OPEN-SOURCE SCRIPT
HTF 6H Visualiser for 30M - ADK - W
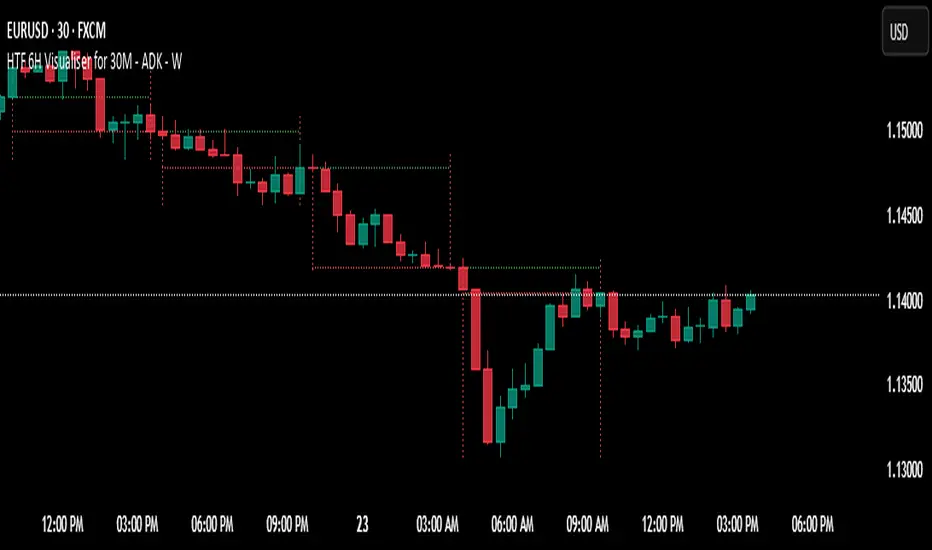
HTF 6H Visualiser — use on 30-minute charts
Purpose – lets 30-minute traders see the prior 6-hour candle’s range, open and close without changing time-frames.
Visual elements
Two dotted vertical lines mark the 6-hour candle’s start and an “early” finish one 30-min bar before the true close (avoids overlap).
Vertical colour: green for bullish 6 H close, red for bearish.
Dotted green horizontal at the 6 H open, red horizontal at the 6 H close – both drawn only between the two verticals.
Verticals are clipped to that candle’s exact high and low.
Data window – auto-deletes oldest guides so only ~2 trading days (8 candles) remain on the chart.
Typical uses – mean-reversion to 6 H opens/closes, quick HTF bias check, liquidity-grab targets.
オープンソーススクリプト
TradingViewの精神に則り、このスクリプトの作者はコードをオープンソースとして公開してくれました。トレーダーが内容を確認・検証できるようにという配慮です。作者に拍手を送りましょう!無料で利用できますが、コードの再公開はハウスルールに従う必要があります。
免責事項
この情報および投稿は、TradingViewが提供または推奨する金融、投資、トレード、その他のアドバイスや推奨を意図するものではなく、それらを構成するものでもありません。詳細は利用規約をご覧ください。
オープンソーススクリプト
TradingViewの精神に則り、このスクリプトの作者はコードをオープンソースとして公開してくれました。トレーダーが内容を確認・検証できるようにという配慮です。作者に拍手を送りましょう!無料で利用できますが、コードの再公開はハウスルールに従う必要があります。
免責事項
この情報および投稿は、TradingViewが提供または推奨する金融、投資、トレード、その他のアドバイスや推奨を意図するものではなく、それらを構成するものでもありません。詳細は利用規約をご覧ください。