PROTECTED SOURCE SCRIPT
HPT - Heikin-Ashi Price Tool
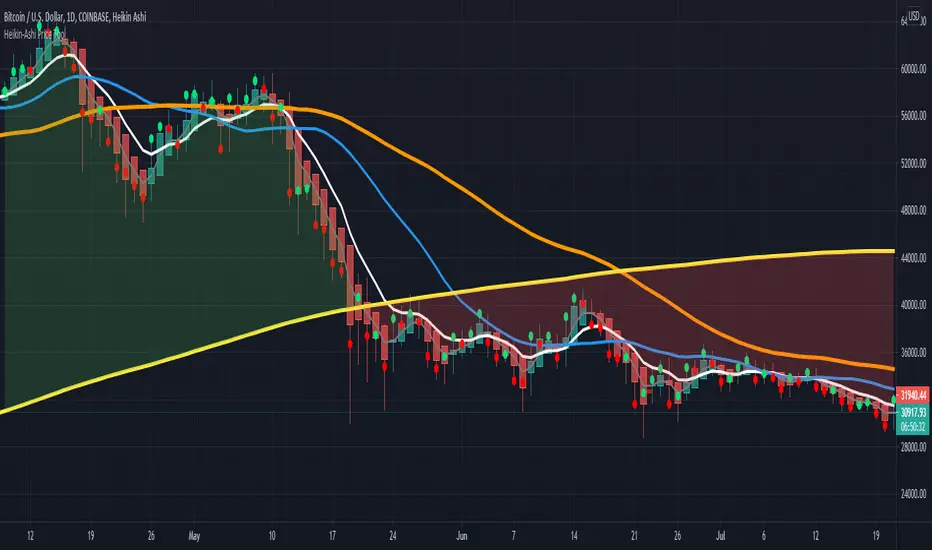
This overlay study can be used with an Heikin-Ashi chart and diplays the real prices for Heikin-Ashi candles as circles for each bar. If the real closing price of the bar is higher then the opening price, the circle has a green color, otherwise it is red.
Here you can see the overlay : BTCUSD
The follwing moving averages are added to the chart as well: SMA 20, 50, 200 and EMA 8 (for analyzing trend and support/resistance ). A background fill can be activated for the overall trend.
I recommend to lower the opacity for the bars so that you can better see the circles for the real prices.
Here you can see the overlay :
The follwing moving averages are added to the chart as well: SMA 20, 50, 200 and EMA 8 (for analyzing trend and support/resistance ). A background fill can be activated for the overall trend.
I recommend to lower the opacity for the bars so that you can better see the circles for the real prices.
保護スクリプト
このスクリプトのソースコードは非公開で投稿されています。 ただし、制限なく自由に使用できます – 詳細はこちらでご確認ください。
Access our indicators from: indivisionx.com
免責事項
この情報および投稿は、TradingViewが提供または推奨する金融、投資、トレード、その他のアドバイスや推奨を意図するものではなく、それらを構成するものでもありません。詳細は利用規約をご覧ください。
保護スクリプト
このスクリプトのソースコードは非公開で投稿されています。 ただし、制限なく自由に使用できます – 詳細はこちらでご確認ください。
Access our indicators from: indivisionx.com
免責事項
この情報および投稿は、TradingViewが提供または推奨する金融、投資、トレード、その他のアドバイスや推奨を意図するものではなく、それらを構成するものでもありません。詳細は利用規約をご覧ください。