INVITE-ONLY SCRIPT
更新済 [SignalFI] AxLe
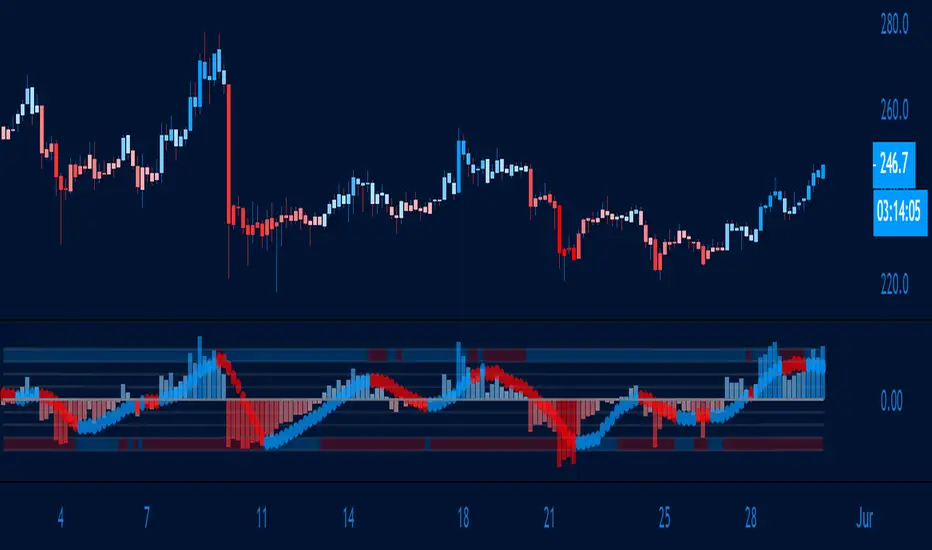
Welcome! Proud to release AxLe! The indicator which provides a trend-based analysis based on volatility, deviations bands, and price momentum. The basis behind AxLe is to essentially give an oscillator view of the difference between key price deviations based on volatility and volume information. The oscillator provides candle coloring matching the scaled colors of the strength of the trend, while the oscillator itself provides key information such as signal line crossovers, baseline crossovers, and AxLe MACD statistics. Taken together, it provides an excellent view of the trend without using moving averages, and well as a way to spot momentum variance and price divergences.
Features:
1) Price/Volume (PV) volatility oscillator based on fractal deviation bands
2) PV signal line to denote PV trend
3) Top/Bottom oscillator horizontal bar color changes based on PV/Signal Line crossovers.
4) Bar coloring to match oscillator performance.
5) Alerts for PV critical levels.
Alerts:
1) Bull Signal X - PV Crossover Signal Line
2) Bear Signal X - PV Crossunder Signal Line
3) Bull Baseline X - PV Crossover Zero Line
4) Bear Baseline X - PV Crossunder Zero Line
USAGE:
1) Follow the color trend
2) User oscillator highs and lows to spot divergences with price highs and lows
3) User PV line and signal line (circles) as indicators for trend change
4) Use Top/Bottom oscillator horizontal bar color changes to indicate tops and bottoms or where momentum is becoming weak.
5) User predefined alerts.
SignalFI was created to help traders and investors to effectively analyze the market based on the Golden Mean Ratio (Fibonacci numbers), plan a trade and ultimately execute it. To help inform and educate market decisions we developed a set of Trading Indicators which are available on TradingView.
SignalFI indicators are just that, indicators. Our indicators are generally configured to use completely historical data (negating repaint), and we advise all alerts created with SignalFI indicators to be fired upon "close" of the current candle. Our indicators can provide valuable context and visualization support when performing market analysis and executing buy and sell decisions. However. we are not financial experts, and all information presented on this site or our other media outlets are for educational purposes only.
リリースノート
Updated to Pine Version 41) Updated Coloring
2) Updated Grid Transparency
招待専用スクリプト
このスクリプトは作者が承認したユーザーのみアクセス可能です。使用するにはアクセス申請をして許可を得る必要があります。通常は支払い後に承認されます。詳細は下記の作者の指示に従うか、SignalFiに直接お問い合わせください。
TradingViewは、作者を完全に信頼し、スクリプトの動作を理解していない限り、有料スクリプトの購入・使用を推奨しません。コミュニティスクリプトには無料のオープンソースの代替が多数あります。
作者の指示
SignalFi is creating cutting edge TradingView scripts to help identify rogue market Alpha. Check out signalfi.net for subscription information and @signalfi_ on Twitter for updates.
免責事項
この情報および投稿は、TradingViewが提供または推奨する金融、投資、トレード、その他のアドバイスや推奨を意図するものではなく、それらを構成するものでもありません。詳細は利用規約をご覧ください。