OPEN-SOURCE SCRIPT
DMI Modified
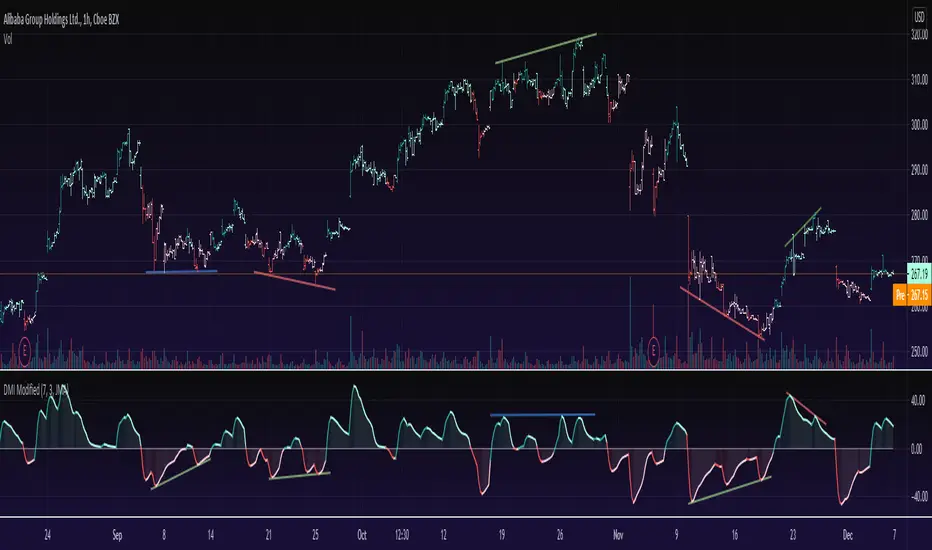
This is a Directional Movement Index (DMI) with a twist, instead of plotting the positive direction of +DI and negative direction for -DI, we subtract the +DI with the -DI on scales of 100 to -100.
The result is plotted with a oscillator to identify the current trend.
DMI Modified supports multiple moving averages (default is JMA with length of 3). You can disable moving averages smoothing in settings.
== About the indicator ==
The Directional Movement Index, or DMI, is an indicator developed by J. Welles Wilder in 1978 that identifies in which direction the price of an asset is moving.
The indicator does this by comparing prior highs and lows and drawing two lines: a positive directional movement line (+DI) and a negative directional movement line (-DI)
In our case we do not draw the two lines, but the result of the subtraction of the two.
== Oscillator Colors ==
GREEN : Asset is above zero line with a strong up trend.
LIGHT GREEN: Asset is above zero line but up trending might be weakening.
RED : Asset is below zero line with a strong downtrend.
LIGHT RED: Asset is below zero line but down trending might be weakening.
== Notes ==
Can also be used to find divergences.
Bar coloring is disabled by default
Like if you like and Enjoy!
There is an idea to make a new strategy combined with DMI Modified (this script) and another script, hench, Follow.
オープンソーススクリプト
TradingViewの精神に則り、このスクリプトの作者はコードをオープンソースとして公開してくれました。トレーダーが内容を確認・検証できるようにという配慮です。作者に拍手を送りましょう!無料で利用できますが、コードの再公開はハウスルールに従う必要があります。
Appreciation of my work: paypal.me/dman103
All Premium indicators: algo.win
LIVE Stream - Pivot Points Algo: youtube.com/channel/UCFyqab-i0xb2jf-c18ufH0A/live
All Premium indicators: algo.win
LIVE Stream - Pivot Points Algo: youtube.com/channel/UCFyqab-i0xb2jf-c18ufH0A/live
免責事項
この情報および投稿は、TradingViewが提供または推奨する金融、投資、トレード、その他のアドバイスや推奨を意図するものではなく、それらを構成するものでもありません。詳細は利用規約をご覧ください。