OPEN-SOURCE SCRIPT
更新済 Forward Cross Projection

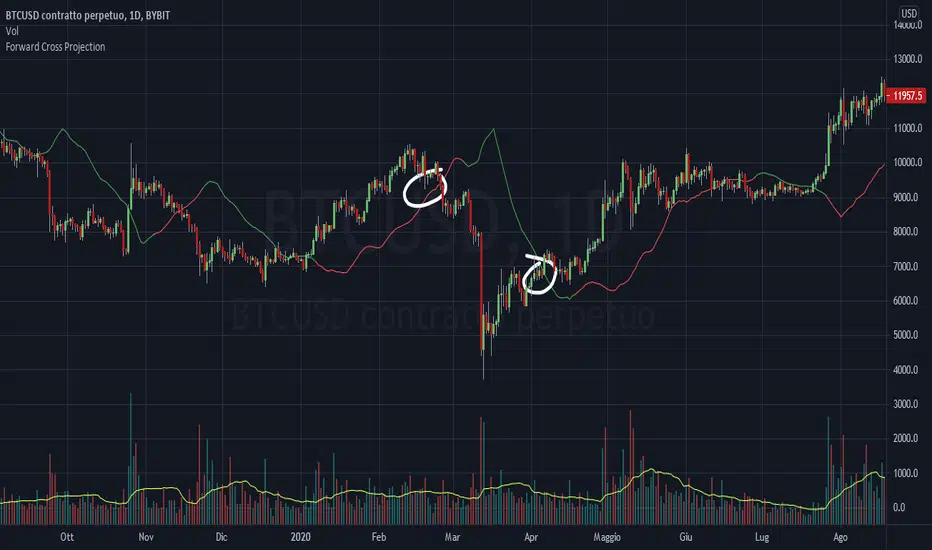
A quick script used to predict the average value the price should have to create a cross between a slow and fast MA at a given time. The line is red when the current cross is bullish and the line is green when the current cross is bearish. Crossing a red line downwards means that the price is getting lower and a bearish death cross is impending. Crossing a green line upwards means that the price is rising and a bullish cross is impending. Script was made thanks to the idea of Dannii
リリースノート
A quick script used to predict the average value the price should have to create a cross between a slow and fast MA at a given time. The line is red when the current cross is bullish and the line is green when the current cross is bearish . Crossing a red line downwards means that the price is getting lower and a bearish death cross is impending. Crossing a green line upwards means that the price is rising and a bullish cross is impending. Script was made thanks to the idea of Dannii.Meaning of the Line
The line signifies the average value the price would need to close at to make a cross at the selected X period between a slow and a quick moving average.
How to trade it
Possibly a Trigger/Exit/Confirmation signal.
Case 1 The fast moving average is right now above the slow moving average
The line turns red and it signifies the price at which candles have to close to create a "Death" Bearish Cross. If the price crosses below the line, it's bound to make the SMAs cross.
If the line is green, the opposite applies. To create a bullish cross you need the price to stay above the green level.
Update 1.0.1
- Fixed quicker period bad calculation
オープンソーススクリプト
TradingViewの精神に則り、このスクリプトの作者はコードをオープンソースとして公開してくれました。トレーダーが内容を確認・検証できるようにという配慮です。作者に拍手を送りましょう!無料で利用できますが、コードの再公開はハウスルールに従う必要があります。
免責事項
この情報および投稿は、TradingViewが提供または推奨する金融、投資、トレード、その他のアドバイスや推奨を意図するものではなく、それらを構成するものでもありません。詳細は利用規約をご覧ください。
オープンソーススクリプト
TradingViewの精神に則り、このスクリプトの作者はコードをオープンソースとして公開してくれました。トレーダーが内容を確認・検証できるようにという配慮です。作者に拍手を送りましょう!無料で利用できますが、コードの再公開はハウスルールに従う必要があります。
免責事項
この情報および投稿は、TradingViewが提供または推奨する金融、投資、トレード、その他のアドバイスや推奨を意図するものではなく、それらを構成するものでもありません。詳細は利用規約をご覧ください。