INVITE-ONLY SCRIPT
RG+B [Intromoto]

Hey folks.
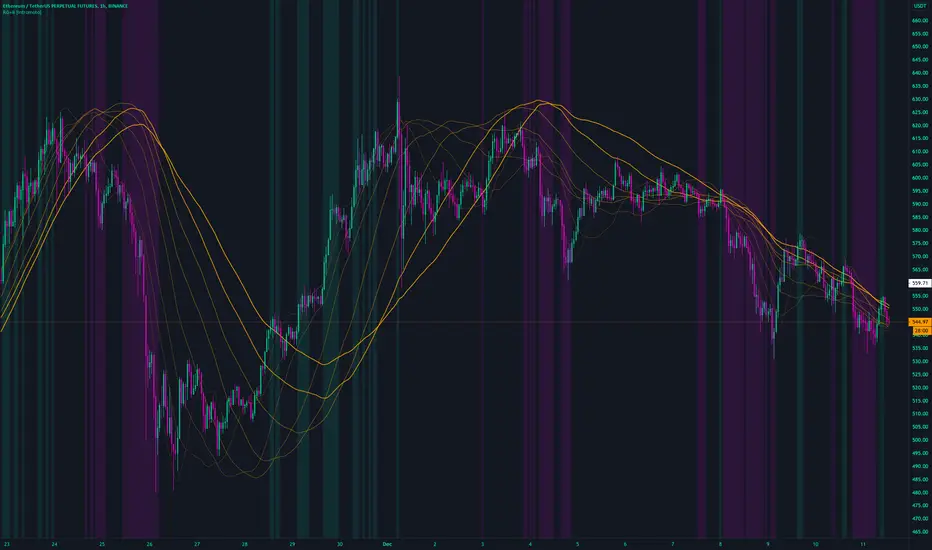
This is an experimental guppy formed from regression lines, instead of the normal EMAs. There are 8 regression plots in total, starting from 25, and progressing in increments of 25, ending in 200.
I've added a bias color in the background to assist in trend directions for when price is above all regression lines or below all regression lines.
Please DM me for trial/access.
Thanks.
免責事項
これらの情報および投稿は、TradingViewが提供または保証する金融、投資、取引、またはその他の種類のアドバイスや推奨を意図したものではなく、またそのようなものでもありません。詳しくは利用規約をご覧ください。