OPEN-SOURCE SCRIPT
更新済 Up Down Volatility

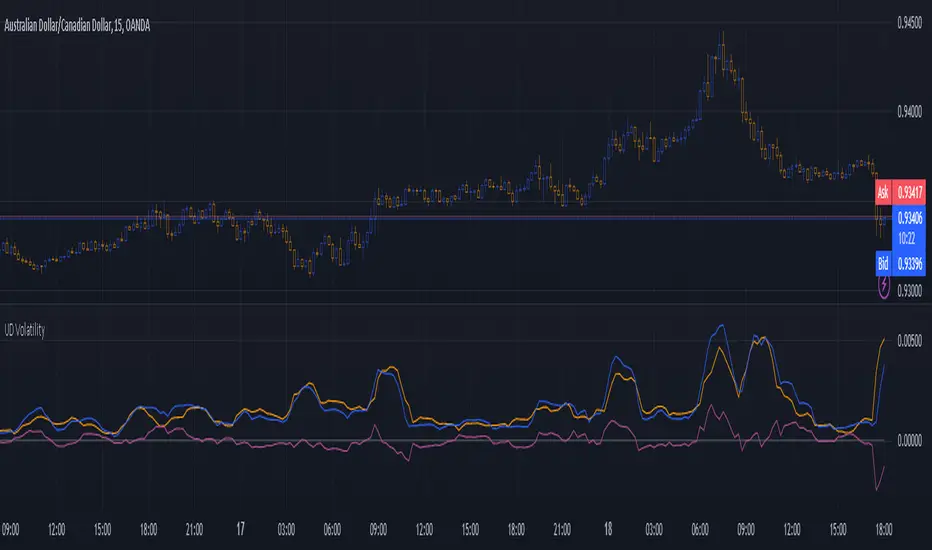
This is just experimental. I wanted the flexibility in looking at volatility and this indicator gives you several ways to do so.
I haven't figured out the best way to use this yet but I suspect that as a form of entry confirmation indicator would be best.
If you find a way this works well for you please drop me a note. It would nice know someone found a way to use it successfully!
The options available are:
* Your source can be price or the ATR.
* It allows you to separate the volatility of the bearish and bullish candles and even allows you to produce differential.
* You can choose to run the result through any one of many smoothers.
With the above options you can look at:
* The normal volatility. That is not split into bearish and bullish components.
* The bearish and bullish volatility and the difference between them.
* The relative bearish and bullish volatility and the difference between them.
The "The relative bearish and bullish" is each one divided into the source before it was split into Up and Down or low/high divided by close which should make the max value roughly around 1.
The code is structured to easily drop into a bigger system so use it as a lone indicator or add the code to some bigger project you are creating. If you do integrate it into something else then send me a note as it would be nice to know it's being well used.
Enjoy and good luck!
リリースノート
Functionally the same. Just some labeling fixes.オープンソーススクリプト
TradingViewの精神に則り、このスクリプトの作者はコードをオープンソースとして公開してくれました。トレーダーが内容を確認・検証できるようにという配慮です。作者に拍手を送りましょう!無料で利用できますが、コードの再公開はハウスルールに従う必要があります。
免責事項
この情報および投稿は、TradingViewが提供または推奨する金融、投資、トレード、その他のアドバイスや推奨を意図するものではなく、それらを構成するものでもありません。詳細は利用規約をご覧ください。
オープンソーススクリプト
TradingViewの精神に則り、このスクリプトの作者はコードをオープンソースとして公開してくれました。トレーダーが内容を確認・検証できるようにという配慮です。作者に拍手を送りましょう!無料で利用できますが、コードの再公開はハウスルールに従う必要があります。
免責事項
この情報および投稿は、TradingViewが提供または推奨する金融、投資、トレード、その他のアドバイスや推奨を意図するものではなく、それらを構成するものでもありません。詳細は利用規約をご覧ください。