OPEN-SOURCE SCRIPT
更新済 MTF ohlc S/R
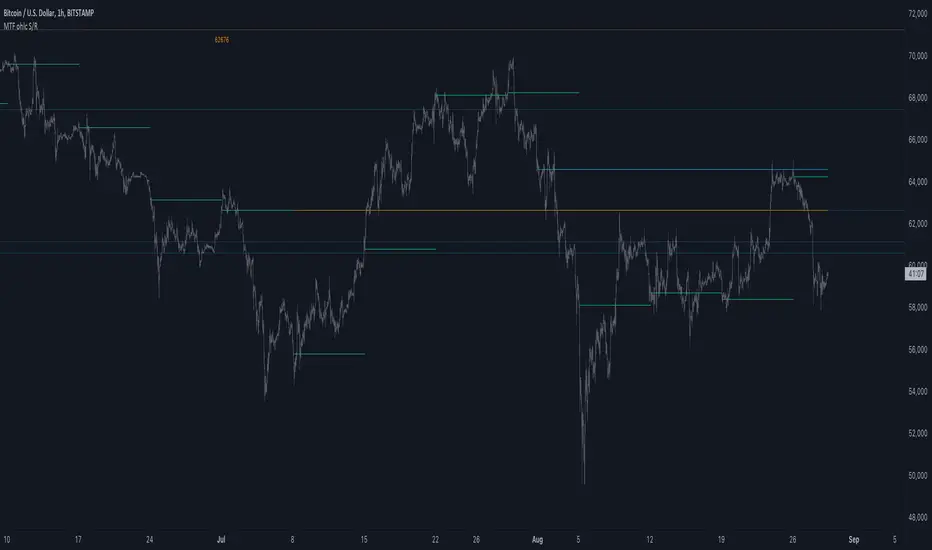
A very simple idea, a close (or high, low, ohlc4 or open) from a higher Time Frame
will give future Support/Resistance area's
In this example of BTC/USD we see:
- Yearly close 2017 gave Resistance in June 2019
- Yearly close 2018 gave Support in March 2020

We are now pushing to the Resistance of Yearly close 2019...
Since there is a limit for the amount of lines (since it is just too much if everything is plotted)
there are different options:
- 4 different Time Frames, each can be enabled/disabled,
- TF can be chosen,
- source can be changed (close, open, high, low, ohlc4)
- Period can be changed, for example TF Month:

You can choose just to show a particular year, Month,...


You also can choose between which prices you want to see lines,
for example Monthly close, since the beginning till now, but only between $6000 - $8000:


This helps to know the closest S/R around the present price
Other example:

- Lines can be extended to the right, or not
- Labels can be enabled/disabled:


- Linewidth and brightness of the line can be changed, also the style (solid, dashed or dotted line)
Default only 2 very high TF's are enabled (3 Month = one quarter, and 1 Year)
The 3 Month has a dotted line, which helps distinguish the line against the yearly line
- Prices above 1000 are rounded since it seems distracting to see for example 6478,878654,
seems better just to see 6479, prices below 1000 are just seen as intended
Have fun!
will give future Support/Resistance area's
In this example of BTC/USD we see:
- Yearly close 2017 gave Resistance in June 2019
- Yearly close 2018 gave Support in March 2020
We are now pushing to the Resistance of Yearly close 2019...
Since there is a limit for the amount of lines (since it is just too much if everything is plotted)
there are different options:
- 4 different Time Frames, each can be enabled/disabled,
- TF can be chosen,
- source can be changed (close, open, high, low, ohlc4)
- Period can be changed, for example TF Month:
You can choose just to show a particular year, Month,...
You also can choose between which prices you want to see lines,
for example Monthly close, since the beginning till now, but only between $6000 - $8000:
This helps to know the closest S/R around the present price
Other example:
- Lines can be extended to the right, or not
- Labels can be enabled/disabled:
- Linewidth and brightness of the line can be changed, also the style (solid, dashed or dotted line)
Default only 2 very high TF's are enabled (3 Month = one quarter, and 1 Year)
The 3 Month has a dotted line, which helps distinguish the line against the yearly line
- Prices above 1000 are rounded since it seems distracting to see for example 6478,878654,
seems better just to see 6479, prices below 1000 are just seen as intended
Have fun!
リリースノート
Added color choice (Color 1 or 2) with different brightnessリリースノート
Updated to v5.Elevated the line limit to 500.
オープンソーススクリプト
TradingViewの精神に則り、このスクリプトの作者はコードをオープンソースとして公開してくれました。トレーダーが内容を確認・検証できるようにという配慮です。作者に拍手を送りましょう!無料で利用できますが、コードの再公開はハウスルールに従う必要があります。
Who are PineCoders?
tradingview.com/chart/SSP/yW5eOqtm-Who-are-PineCoders/
TG Pine Script® Q&A: t.me/PineCodersQA
- We cannot control our emotions,
but we can control our keyboard -
tradingview.com/chart/SSP/yW5eOqtm-Who-are-PineCoders/
TG Pine Script® Q&A: t.me/PineCodersQA
- We cannot control our emotions,
but we can control our keyboard -
免責事項
この情報および投稿は、TradingViewが提供または推奨する金融、投資、トレード、その他のアドバイスや推奨を意図するものではなく、それらを構成するものでもありません。詳細は利用規約をご覧ください。