OPEN-SOURCE SCRIPT
更新済 The Strat Screener - yungchopps

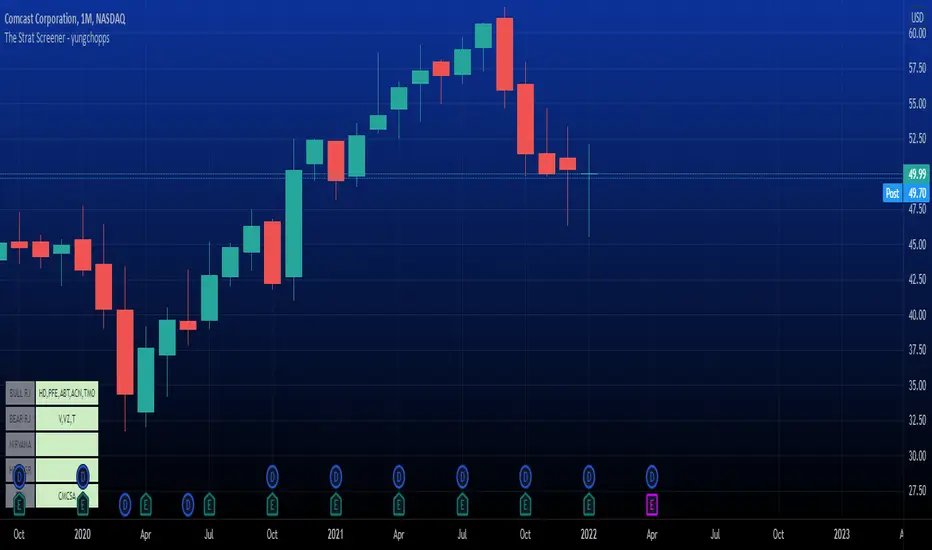
This indicator scan up to 40 tickers of your choice for bullish and bearish Randy Jackson setups. Randy Jackson setups are 2u-2u-2d-2u for bullish cases and 2d-2d-2u-2d for bearish cases. If a ticker has a possible RJ setup, the ticker name will be display on the table depending if it is bullish or bearish. The only thing you need to do it change one of the default tickers to the ones you desire and the table will update if there are any RJ setups. The indicators search for RJ setups on the current timeframe that you are on.
Randy Jackson setups are part of the 'Strat' candlestick analysist. More information about the Strat can be found on the internet and YouTube. This indicator reads the previous candles of every selected ticker and searched for a RJ setup. If one exist, it will update the table with the tickers name. I will add more setups in the future.
This is a screener. This indicator really just makes it easier to scan many indicators at once. Its not hard to use... just place it on the chart and it will do the work for you. Hopefully mods find this enough of a description...
リリースノート
Added two new setups and one improvement.The improvement: Got rid of the exchange name when posting the tickers on the table. This makes the table cleaner and removes unneeded info.
Added Nirvana setup:
This setup is an inside bar (equivalent as 1 for 'Strat') followed by an outside bar (equivalent as 3 for 'Strat). Traders can play this both ways depending on the direction of the outside bar.
Added Holy Grail setup:
This isn't technically part of the 'Strat', but due to request I added it in since it is still a price action setup. This setup the opposite of the Nirvana and is an outside bar followed by an inside bar.
リリースノート
Added the 50% retracement setup to the indicator.This setups is helpful to find a possible outside bar formation that is about to occur. This setups will look for a strong push in price in one direction and then a reversal that passes through the 50% retracement of the previous candle. Once the current price is below the 50% retracement, the indicator will update the table with the ticker.
リリースノート
This small updated adds the 2-1-2 setup to the screener. This setup is extremely powerful as it could be either a continuation or reversal setup. The screener does not indicate if it is a bullish or bearish setup. Instead, the screener just finds a 2 candle that is followed by a 1 candle. If this setup is present, it will indicate it on the table with the ticker name where the setup is present. It is up to the trader to decide if this is bullish/bearish or if it is a continuation/ reversal. リリースノート
It was brought to my attention that the table is hard to view if you have color vision deficiency. I have added an input so that if you have a hard time viewing the table the colors would change to make it easier to read. I also cleaned the code up for my own sake (:For Strat nicknames on the table, I added their respective formation so that it would be easier to follow in case you are not aware of the nicknames.
オープンソーススクリプト
TradingViewの精神に則り、このスクリプトの作者はコードをオープンソースとして公開してくれました。トレーダーが内容を確認・検証できるようにという配慮です。作者に拍手を送りましょう!無料で利用できますが、コードの再公開はハウスルールに従う必要があります。
免責事項
この情報および投稿は、TradingViewが提供または推奨する金融、投資、トレード、その他のアドバイスや推奨を意図するものではなく、それらを構成するものでもありません。詳細は利用規約をご覧ください。
オープンソーススクリプト
TradingViewの精神に則り、このスクリプトの作者はコードをオープンソースとして公開してくれました。トレーダーが内容を確認・検証できるようにという配慮です。作者に拍手を送りましょう!無料で利用できますが、コードの再公開はハウスルールに従う必要があります。
免責事項
この情報および投稿は、TradingViewが提供または推奨する金融、投資、トレード、その他のアドバイスや推奨を意図するものではなく、それらを構成するものでもありません。詳細は利用規約をご覧ください。