OPEN-SOURCE SCRIPT
更新済 Volume Divergence Polarity Grid [DW]
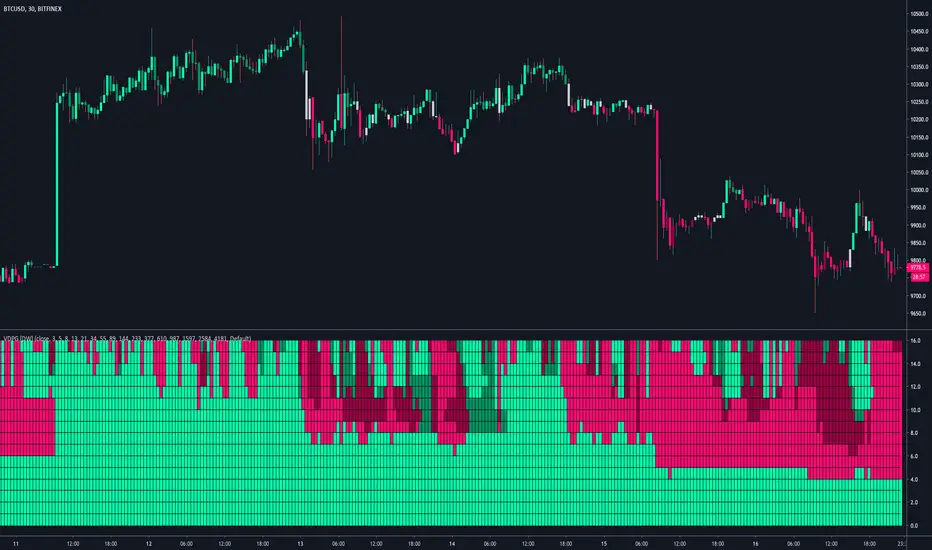
This study is an experiment built off the framework of my Dual Volume Divergence Index indicator.
It is designed to gauge polarity over multiple lookback periods of your choice by expressing the data as a two color grid.
Positive Volume Divergence and Negative Volume Divergence are calculated, and their relative values are used to gauge polarity.
The order of the grid is top to bottom - the top is the first lookback period, and the bottom is the last.
リリースノート
Updates:-> Migrated to v4.
-> Condensed DVDI calculations into a singular function.
-> Corrected NaN values to stabilize initial conditions.
-> Added 7 more Polarity lines.
-> Reorganized script structure.
-> Eliminated fills. Indications are now expressed as columns.
-> Revamped color scheme.
オープンソーススクリプト
TradingViewの精神に則り、このスクリプトの作者はコードをオープンソースとして公開してくれました。トレーダーが内容を確認・検証できるようにという配慮です。作者に拍手を送りましょう!無料で利用できますが、コードの再公開はハウスルールに従う必要があります。
For my full list of premium tools, check the blog:
wallanalytics.com/
Reach out on Telegram:
t.me/DonovanWall
wallanalytics.com/
Reach out on Telegram:
t.me/DonovanWall
免責事項
この情報および投稿は、TradingViewが提供または推奨する金融、投資、トレード、その他のアドバイスや推奨を意図するものではなく、それらを構成するものでもありません。詳細は利用規約をご覧ください。