OPEN-SOURCE SCRIPT
更新済 DTB

Dynamic Trendline Bands with Buy/Sell Pressure Detection
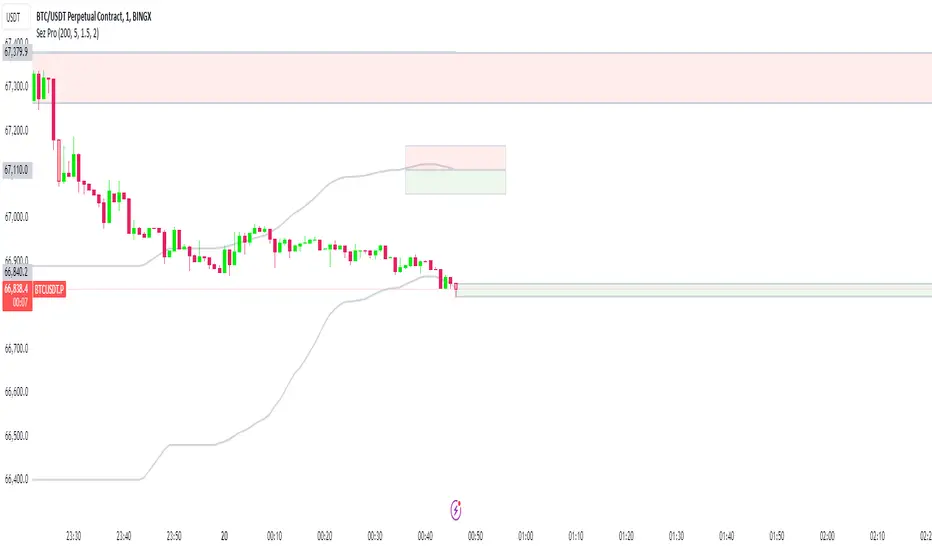
This indicator provides a comprehensive analysis of price movements by incorporating smoothed high and low bands, a midline, and the detection of buying and selling pressure. It is designed to help traders identify key support and resistance levels as well as potential buy and sell signals.
**Features:**
- **Smooth High and Low Bands:** Based on the highest high and lowest low over a specified period, smoothed using a simple moving average (SMA) to reduce noise and enhance clarity.
- **Midline:** The average of the smoothed high and low bands, providing a central reference point for price movements.
- **Buying and Selling Pressure Detection:** Highlights candles with significant buying or selling pressure, indicated by light green for buying pressure and light red for selling pressure. This is determined based on volume thresholds and price movement.
- **Trendlines:** Dynamic trendlines are drawn based on recent highs and lows, helping to visualize the current trend direction.
**How to Use:**
1. **High-Low Bands:** Use these bands to identify key support and resistance levels.
2. **Midline:** Monitor the midline for potential mean reversion trades.
3. **Buying/Selling Pressure Candles:** Look for candles highlighted in light green or red to identify potential buy or sell signals.
4. **Trendlines:** Follow the dynamic trendlines to understand the direction of the current trend.
**Inputs:**
- **Length:** Number of bars to consider for calculating the highest high and lowest low (default: 200).
- **Smooth Length:** Period for the simple moving average to smooth the high and low bands (default: 10).
- **Volume Threshold Multiplier:** Multiplier for the average volume to detect significant buying or selling pressure (default: 1.5).
This indicator is suitable for all timeframes and can be used in conjunction with other technical analysis tools to enhance your trading strategy.
リリースノート
New designオープンソーススクリプト
TradingViewの精神に則り、このスクリプトの作者はコードをオープンソースとして公開してくれました。トレーダーが内容を確認・検証できるようにという配慮です。作者に拍手を送りましょう!無料で利用できますが、コードの再公開はハウスルールに従う必要があります。
免責事項
この情報および投稿は、TradingViewが提供または推奨する金融、投資、トレード、その他のアドバイスや推奨を意図するものではなく、それらを構成するものでもありません。詳細は利用規約をご覧ください。
オープンソーススクリプト
TradingViewの精神に則り、このスクリプトの作者はコードをオープンソースとして公開してくれました。トレーダーが内容を確認・検証できるようにという配慮です。作者に拍手を送りましょう!無料で利用できますが、コードの再公開はハウスルールに従う必要があります。
免責事項
この情報および投稿は、TradingViewが提供または推奨する金融、投資、トレード、その他のアドバイスや推奨を意図するものではなく、それらを構成するものでもありません。詳細は利用規約をご覧ください。