OPEN-SOURCE SCRIPT
Standard deviation channel of linear regression distance [AbAh]
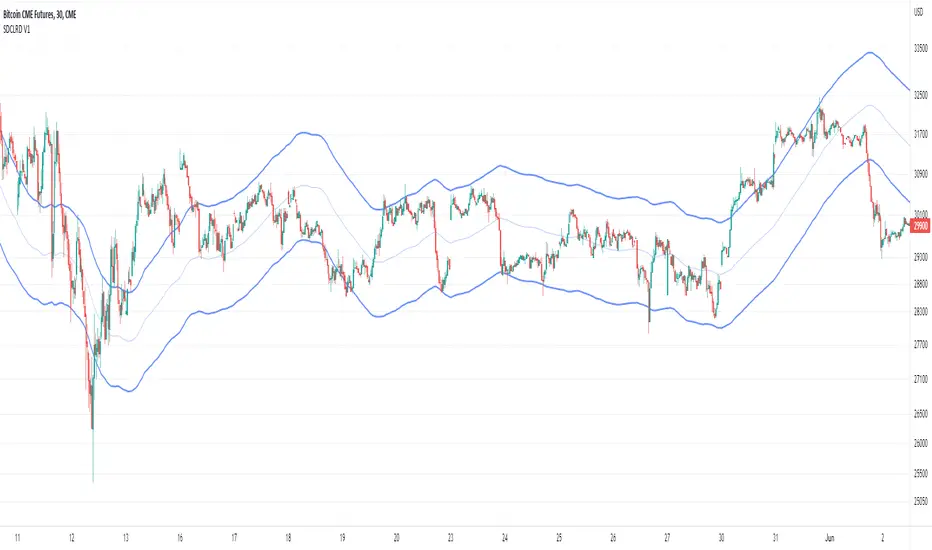
The indicator calculates the distance between linear regression line and the data point (price) as a percentage , then calculates the standard deviation for the linear regression distance , then draw the channel of two lines depending on the values of standard deviation .
///////// How to use ////////////////
1 - for Best result , indicator should be used on 2H frame Time of less : like 1H or 30 min
2 - The upper line and the lower line, both play a role as a support and resistance area, when the price bounces from the upper zone or lower zone, there is a high probability that it will move to the other line.
3 - The price breakout of one of the lower or upper lines may indicate a major price movement coming in the direction of the breakout
/////////////////////////////////////
オープンソーススクリプト
TradingViewの精神に則り、このスクリプトの作者はコードをオープンソースとして公開してくれました。トレーダーが内容を確認・検証できるようにという配慮です。作者に拍手を送りましょう!無料で利用できますが、コードの再公開はハウスルールに従う必要があります。
免責事項
この情報および投稿は、TradingViewが提供または推奨する金融、投資、トレード、その他のアドバイスや推奨を意図するものではなく、それらを構成するものでもありません。詳細は利用規約をご覧ください。
オープンソーススクリプト
TradingViewの精神に則り、このスクリプトの作者はコードをオープンソースとして公開してくれました。トレーダーが内容を確認・検証できるようにという配慮です。作者に拍手を送りましょう!無料で利用できますが、コードの再公開はハウスルールに従う必要があります。
免責事項
この情報および投稿は、TradingViewが提供または推奨する金融、投資、トレード、その他のアドバイスや推奨を意図するものではなく、それらを構成するものでもありません。詳細は利用規約をご覧ください。