OPEN-SOURCE SCRIPT
Sniper Entry
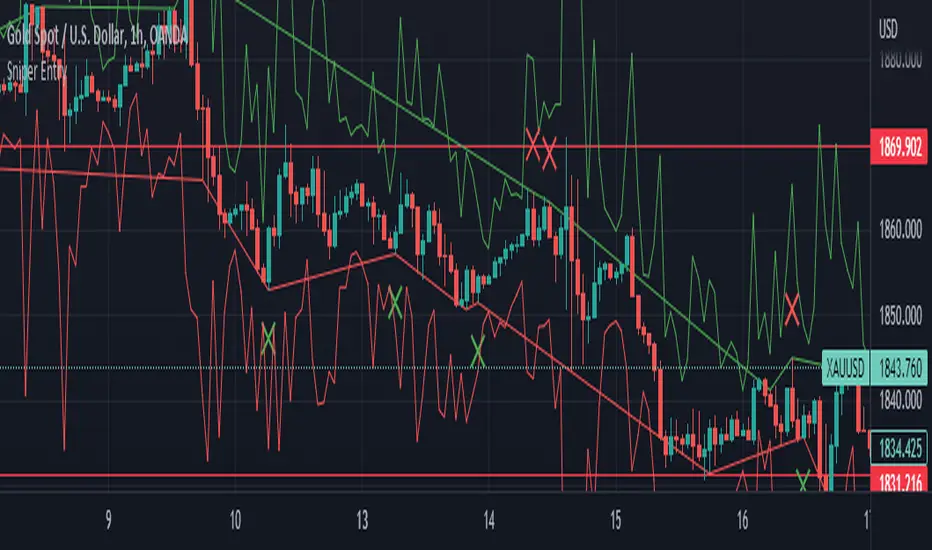
This source code is an implementation of a TradingView indicator called "Sniper Entry". The purpose of this indicator is to identify potential entry points for trades based on certain candlestick patterns and the Stochastic oscillator.
The indicator calculates the Stochastic oscillator based on the close, high, and low prices of the asset over a period of 14 bars. It then uses this oscillator to generate buy and sell signals.
For a buy signal to be generated, the Stochastic oscillator must cross above the oversold level of 20, and the current candle must either be a bullish pin bar or a bullish engulfing pattern. For a sell signal to be generated, the Stochastic oscillator must cross below the overbought level of 80, and the current candle must either be a bearish pin bar or a bearish engulfing pattern.
The indicator also calculates the stop loss and target levels for both buy and sell trades. The stop loss is calculated based on the low or high of the candle that generated the signal, depending on whether it's a buy or sell signal. The target is calculated based on the risk/reward ratio, which is set to 3 in this implementation. The lot size is also set to 0.01, and the starting capital is set to 100.
The indicator then plots the buy and sell signals, the stop loss and target levels, and the Stochastic oscillator on the chart.
It's important to note that this is just one example of a trading indicator, and its effectiveness may vary depending on market conditions and the asset being traded. It's also important to perform your own analysis and use proper risk management techniques when making trades based on any indicator or strategy.
オープンソーススクリプト
TradingViewの精神に則り、このスクリプトの作者はコードをオープンソースとして公開してくれました。トレーダーが内容を確認・検証できるようにという配慮です。作者に拍手を送りましょう!無料で利用できますが、コードの再公開はハウスルールに従う必要があります。
免責事項
この情報および投稿は、TradingViewが提供または推奨する金融、投資、トレード、その他のアドバイスや推奨を意図するものではなく、それらを構成するものでもありません。詳細は利用規約をご覧ください。
オープンソーススクリプト
TradingViewの精神に則り、このスクリプトの作者はコードをオープンソースとして公開してくれました。トレーダーが内容を確認・検証できるようにという配慮です。作者に拍手を送りましょう!無料で利用できますが、コードの再公開はハウスルールに従う必要があります。
免責事項
この情報および投稿は、TradingViewが提供または推奨する金融、投資、トレード、その他のアドバイスや推奨を意図するものではなく、それらを構成するものでもありません。詳細は利用規約をご覧ください。