INVITE-ONLY SCRIPT
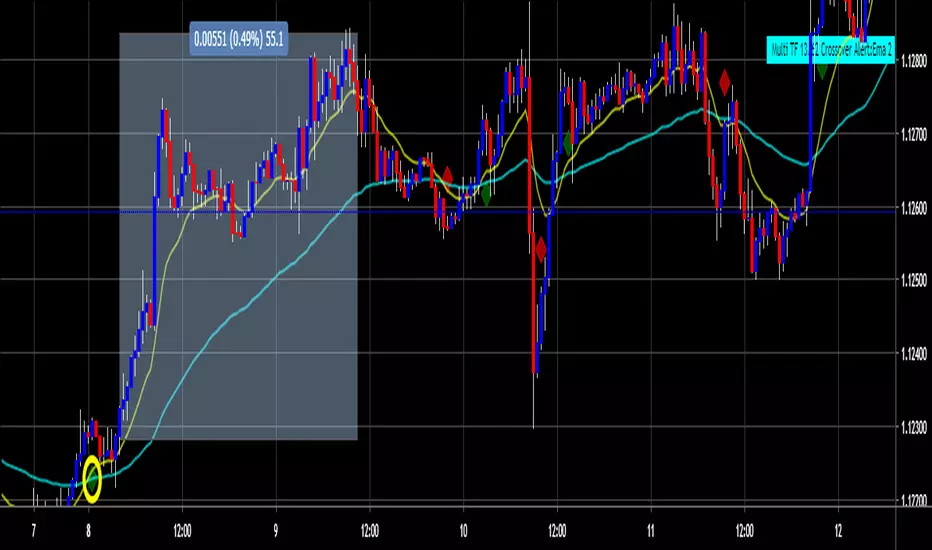
Multi TF 13/62 Crossover w/ Alert

Simple indicator that shows Green Diamond for buy and Red Diamond for sell. Script is built for 13/62 EMA crossover on the 30M chart, but can be used on any timeframe. You can select for any timeframe so if on 5M chart you can select 30M EMA's. Only 2 EMA's to enter. After 13 crosses 62 look for the buy entry and make sure it is in a trend and not consolidating. Add other confirmations and strategies in where necessary.
免責事項
これらの情報および投稿は、TradingViewが提供または保証する金融、投資、取引、またはその他の種類のアドバイスや推奨を意図したものではなく、またそのようなものでもありません。詳しくは利用規約をご覧ください。