OPEN-SOURCE SCRIPT
更新済 NK Sir's SRT
First of all I would like to thanks Nitish Sir for teaching us the concept of SRT, which proves to be an excellent tool for Investing.
- In a year, there are around 248 to 252 trading days .
On dividing the same by 2 we get 124. Even 125 / 126 can be taken.
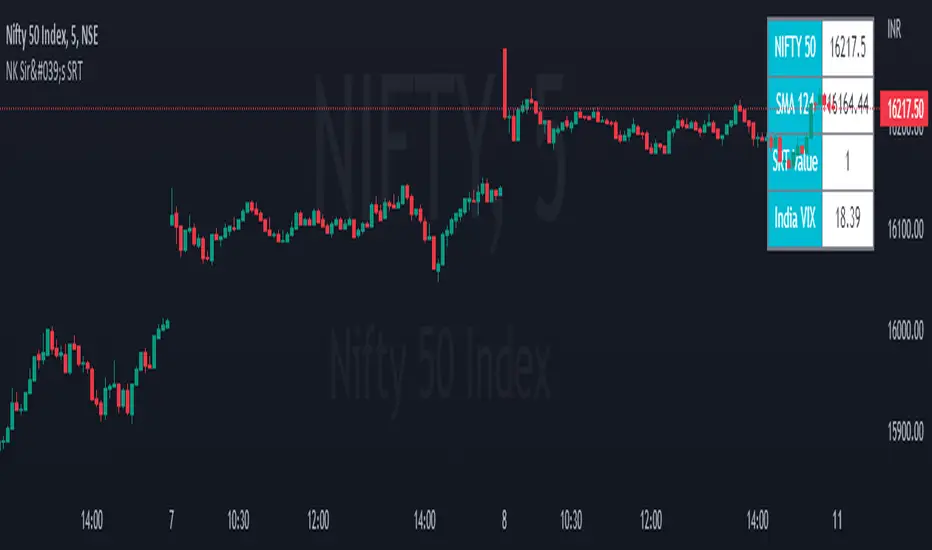
We get SRT value by dividing Nifty Spot with 124 SMA value & SRT is applicable on Nifty in a Day Chart.
This value ranges in between 0.6 (Low) to 1.38/1.4/1.45/1.5 (High).
Ideal Entry in a stock will be at 0.6, which is very rare. You tend to buy at 0.7/0.8/0.9/1.10.
Exit from a stock will be at 1.3 - 1.5.
However generally we get a value of 0.8/0.9 and we should start investing 20 % of our capital that we have planned to invest. For every 0.1 decrease in SRT Value, we should add 20% to the stock portfolio.
Start Booking Profit if SRT value above 1.35 & book 50 % of the portfolio when SRT value is 1.45.
For Traders, as an when SRT value comes to 0.8/ 0.9. Buy when Hilega Milega gives us a clear BUY signal on Monthly Time Frame.
Stock bought at SRT value of 0.6 tend to double in a year. It generally quite rare to see a SRT Value of 0.6.
リリースノート
Just added the Daily India VIX value to the Info Table.リリースノート
Just corrected the VIX value as was facing some issues in the previous version.オープンソーススクリプト
TradingViewの精神に則り、このスクリプトの作者はコードをオープンソースとして公開してくれました。トレーダーが内容を確認・検証できるようにという配慮です。作者に拍手を送りましょう!無料で利用できますが、コードの再公開はハウスルールに従う必要があります。
免責事項
この情報および投稿は、TradingViewが提供または推奨する金融、投資、トレード、その他のアドバイスや推奨を意図するものではなく、それらを構成するものでもありません。詳細は利用規約をご覧ください。
オープンソーススクリプト
TradingViewの精神に則り、このスクリプトの作者はコードをオープンソースとして公開してくれました。トレーダーが内容を確認・検証できるようにという配慮です。作者に拍手を送りましょう!無料で利用できますが、コードの再公開はハウスルールに従う必要があります。
免責事項
この情報および投稿は、TradingViewが提供または推奨する金融、投資、トレード、その他のアドバイスや推奨を意図するものではなく、それらを構成するものでもありません。詳細は利用規約をご覧ください。