OPEN-SOURCE SCRIPT
更新済 (mab) ATR Band
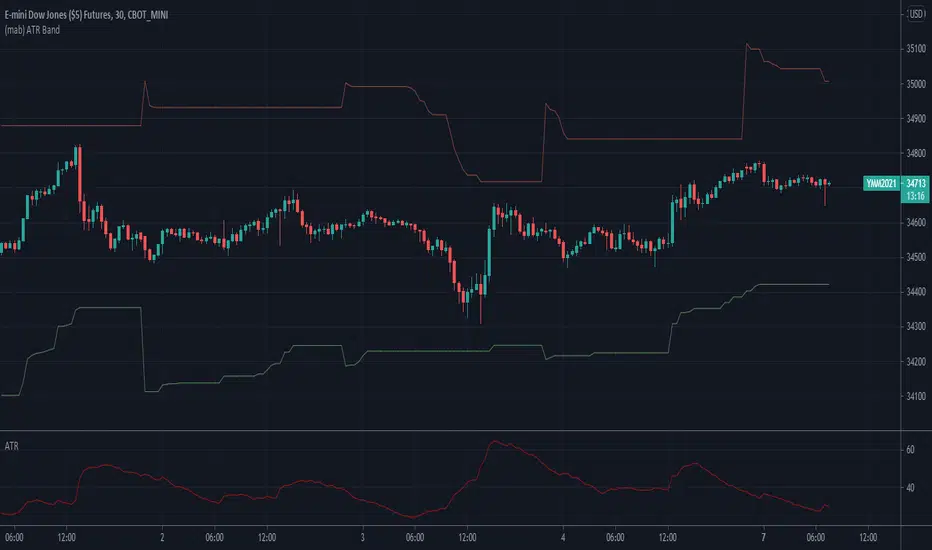
Simple ATR band as overlay on price chart.
リリースノート
This updated version is more advanced. It plots a simple ATR band on daily and higher time frames. On intraday charts it can plot a dynamic band that takes the previous days ATR as starting point. At new lows it lowers the upper band to the new low plus the previous days ATR. At new highs it rises the lower band to the new high minus the previous days ATR.リリースノート
This update enhances the (mab) ATR Band indicator with multi time frame capabilities. If "Floating daily ATR on intraday charts" is enabled, it shows the previous days ATR value as a starting point at the start of the session on intraday charts. At new lows it lowers the upper band to the new low plus the previous days ATR. At new highs it rises the lower band to the new high minus the previous days ATR.Similarly if "Floating weekly/monthly ATR on daily/weekly charts" is enabled, it shows the previous weeks ATR as starting point on daily charts and the previous months ATR on weekly charts. At new lows it lowers the upper band to the new low plus the previous weeks/moths ATR. At new highs it rises the lower band to the new high minus the previous weeks/months ATR.
オープンソーススクリプト
TradingViewの精神に則り、このスクリプトの作者はコードをオープンソースとして公開してくれました。トレーダーが内容を確認・検証できるようにという配慮です。作者に拍手を送りましょう!無料で利用できますが、コードの再公開はハウスルールに従う必要があります。
免責事項
この情報および投稿は、TradingViewが提供または推奨する金融、投資、トレード、その他のアドバイスや推奨を意図するものではなく、それらを構成するものでもありません。詳細は利用規約をご覧ください。
オープンソーススクリプト
TradingViewの精神に則り、このスクリプトの作者はコードをオープンソースとして公開してくれました。トレーダーが内容を確認・検証できるようにという配慮です。作者に拍手を送りましょう!無料で利用できますが、コードの再公開はハウスルールに従う必要があります。
免責事項
この情報および投稿は、TradingViewが提供または推奨する金融、投資、トレード、その他のアドバイスや推奨を意図するものではなく、それらを構成するものでもありません。詳細は利用規約をご覧ください。