OPEN-SOURCE SCRIPT
VOLD-MarketBreadth-Ratio
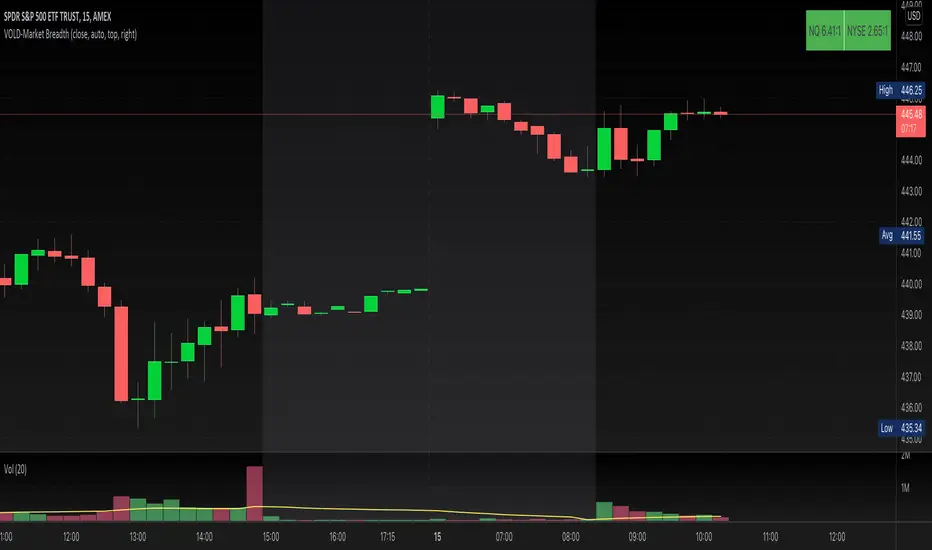
This script provides NASDAQ and NYSE Up Volume (volume in rising stocks) and Down Volume (volume in falling stocks) ratio. Up Volume is higher than Down Volume, then you would see green label with ratio e.g 3.5:1. This means Up Volume is 3.5 times higher than Down Volume - Positive Market Breadth. If Down Volume is higher than Up Volume, then you would see red label with ratio e.g -4.5:1. This means Down Volume is 4.5 times higher than Up Volume.
For example, ratio is 1:1, then it is considered Market Breadth is Neutral.
PS: Currently TradingView provides only NASDAQ Composite Market volume data. I have requested them to provide Primary NASDAQ volume data. If they respond with new ticket for primary NQ data, I will update the script and publish the updated version. So if you have got similar table on ToS, you would see minor difference in NQ ratio.
オープンソーススクリプト
TradingViewの精神に則り、このスクリプトの作者はコードをオープンソースとして公開してくれました。トレーダーが内容を確認・検証できるようにという配慮です。作者に拍手を送りましょう!無料で利用できますが、コードの再公開はハウスルールに従う必要があります。
免責事項
この情報および投稿は、TradingViewが提供または推奨する金融、投資、トレード、その他のアドバイスや推奨を意図するものではなく、それらを構成するものでもありません。詳細は利用規約をご覧ください。
オープンソーススクリプト
TradingViewの精神に則り、このスクリプトの作者はコードをオープンソースとして公開してくれました。トレーダーが内容を確認・検証できるようにという配慮です。作者に拍手を送りましょう!無料で利用できますが、コードの再公開はハウスルールに従う必要があります。
免責事項
この情報および投稿は、TradingViewが提供または推奨する金融、投資、トレード、その他のアドバイスや推奨を意図するものではなく、それらを構成するものでもありません。詳細は利用規約をご覧ください。