OPEN-SOURCE SCRIPT
Lowry Upside % Volume
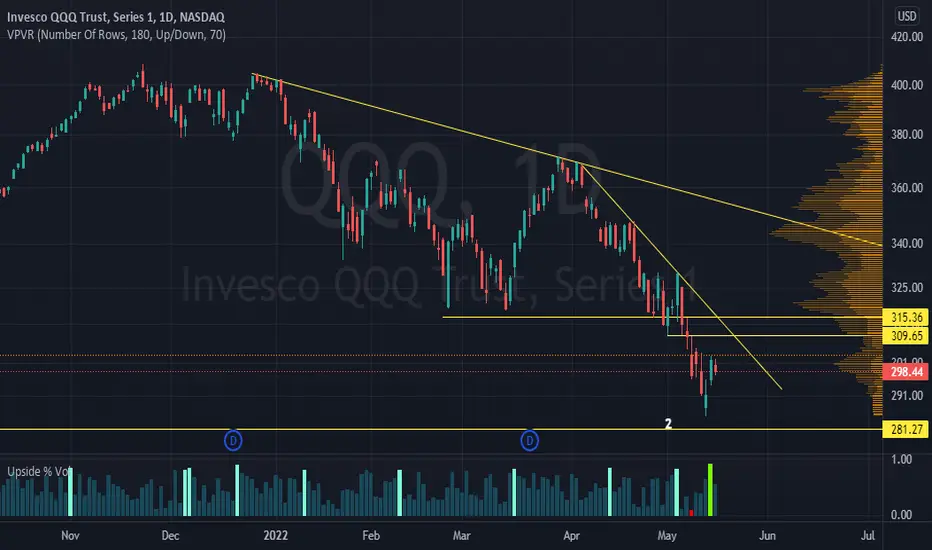
This script takes the total NYSE volume for the day and determines what percentage of that volume is Upside Volume (or buying volume).
What's different in this script compared to others is that the 3 most essential values determined by Paul F. Desmond's Dow Award-winning paper for Lowry's Reports are color coded:
1) 90% Upside Volume Day
2) 80% Upside Volume Day
3) 90% Downside Volume Day
According to Paul's award-winning research, these precise criteria are objective definitions of panic selling and panic buying and are generally near major market tops and bottoms.
His Dow Award-winning paper on the topic can be explored and scrutinized in more detail here:
docs.cmtassociation.org/docs/2002DowAwardb.pdf
オープンソーススクリプト
TradingViewの精神に則り、このスクリプトの作者はコードをオープンソースとして公開してくれました。トレーダーが内容を確認・検証できるようにという配慮です。作者に拍手を送りましょう!無料で利用できますが、コードの再公開はハウスルールに従う必要があります。
免責事項
この情報および投稿は、TradingViewが提供または推奨する金融、投資、トレード、その他のアドバイスや推奨を意図するものではなく、それらを構成するものでもありません。詳細は利用規約をご覧ください。
オープンソーススクリプト
TradingViewの精神に則り、このスクリプトの作者はコードをオープンソースとして公開してくれました。トレーダーが内容を確認・検証できるようにという配慮です。作者に拍手を送りましょう!無料で利用できますが、コードの再公開はハウスルールに従う必要があります。
免責事項
この情報および投稿は、TradingViewが提供または推奨する金融、投資、トレード、その他のアドバイスや推奨を意図するものではなく、それらを構成するものでもありません。詳細は利用規約をご覧ください。