OPEN-SOURCE SCRIPT
更新済 ThiccZones
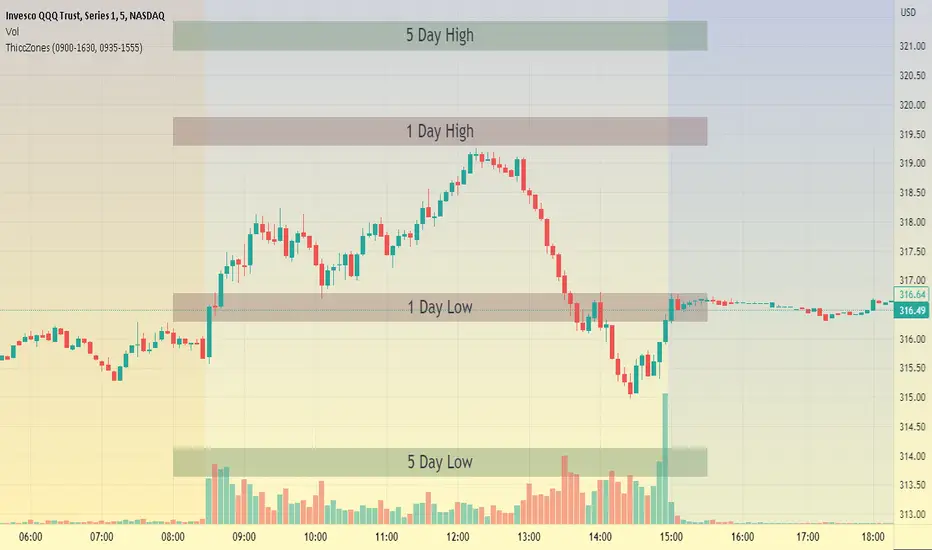
This indicator is a formula that includes 4 different zones which are different sizes based on the ticker you decide to use. It was optimized for SPY and other market ETFs but works well for all stocks on the market. The formula puts a zone at the previous day's high and low, and the previous 5 day's high and low. These zones are meant to be used as support and resistance and can even overlap, creating a 'master zone'. This is different than other zone indicators because the formula for these zones is something I created myself and have been unable to find on here. I have had the most success using a 1-15 minute chart and using my zones for reversal areas. I often look for other indications of reversal as well that line up with the area of the zones. It can also be used on the break and retest of these zones. I have found that when a stock breaks one of these zones it will often retest and continue that trend.
リリースノート
Version 2.0 allows for the zones to be used regardless of extended hours or regular hours. We also added a label for each zone to help you identify them.リリースノート
Fixed bug with 5 day lowオープンソーススクリプト
TradingViewの精神に則り、このスクリプトの作者はコードをオープンソースとして公開してくれました。トレーダーが内容を確認・検証できるようにという配慮です。作者に拍手を送りましょう!無料で利用できますが、コードの再公開はハウスルールに従う必要があります。
免責事項
この情報および投稿は、TradingViewが提供または推奨する金融、投資、トレード、その他のアドバイスや推奨を意図するものではなく、それらを構成するものでもありません。詳細は利用規約をご覧ください。
オープンソーススクリプト
TradingViewの精神に則り、このスクリプトの作者はコードをオープンソースとして公開してくれました。トレーダーが内容を確認・検証できるようにという配慮です。作者に拍手を送りましょう!無料で利用できますが、コードの再公開はハウスルールに従う必要があります。
免責事項
この情報および投稿は、TradingViewが提供または推奨する金融、投資、トレード、その他のアドバイスや推奨を意図するものではなく、それらを構成するものでもありません。詳細は利用規約をご覧ください。