PROTECTED SOURCE SCRIPT
RSI de Loquy
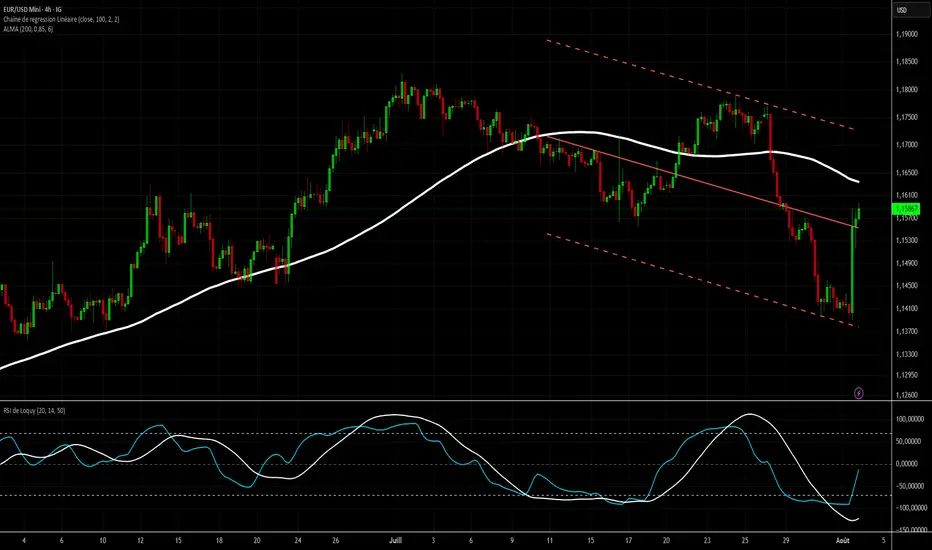
Indicator Description: RSI de Loquy
This custom indicator blends the power of the Relative Strength Index (RSI) with the Hull Moving Average (HMA), enhanced by a linear regression to reveal underlying momentum trends.
How It Works:
The RSI is calculated not on price directly, but on the HMA, offering a smoother and more responsive signal.
The RSI is remapped to a -100 to +100 scale for more intuitive reading:
+100 = extreme oversold
-100 = extreme overbought
A linear regression line is plotted over the rescaled RSI to highlight trend direction and strength.
Usage Tips:
Reversed overbought/oversold levels:
Above +70 = potential oversold condition
Below -70 = potential overbought condition
The white regression line helps confirm trend shifts or momentum continuation.
⚙️ Customizable Inputs:
HMA period
RSI length
Regression length
保護スクリプト
このスクリプトのソースコードは非公開で投稿されています。 ただし、制限なく自由に使用できます – 詳細はこちらでご確認ください。
免責事項
この情報および投稿は、TradingViewが提供または推奨する金融、投資、トレード、その他のアドバイスや推奨を意図するものではなく、それらを構成するものでもありません。詳細は利用規約をご覧ください。
免責事項
この情報および投稿は、TradingViewが提供または推奨する金融、投資、トレード、その他のアドバイスや推奨を意図するものではなく、それらを構成するものでもありません。詳細は利用規約をご覧ください。