OPEN-SOURCE SCRIPT
Global Net Liquidity - Offset
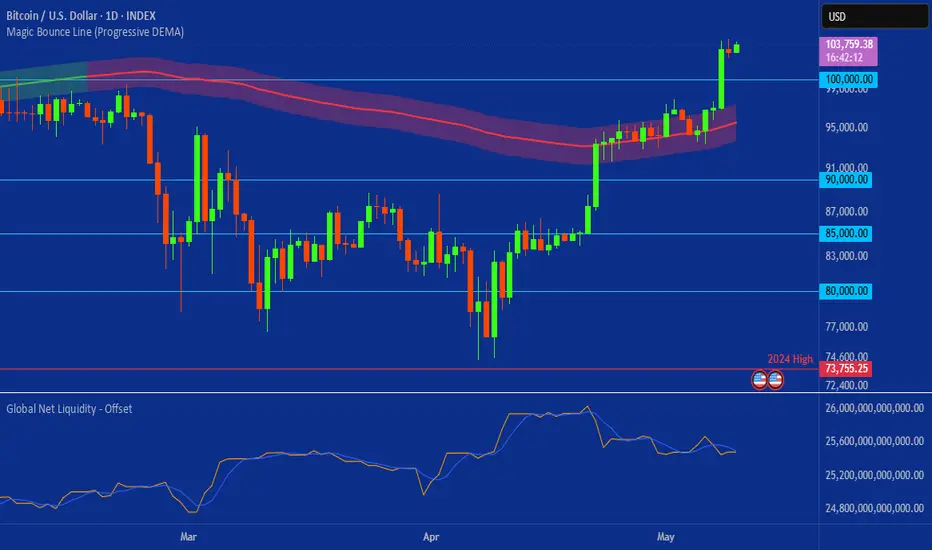
Purpose
This indicator tracks the combined balance-sheet liquidity provided by the world’s five largest central banks, then subtracts the U.S. Treasury General Account (TGA) and the Fed’s Reverse Repo Facility (RRP).
The result is a high-level proxy for global US-dollar availability that many market participants see leading risk-asset trends.
Formula
Fed Assets (FRED: WALCL)
+ BoJ Assets × USDJPY
+ PBoC Assets × USDCNY
+ BoE Assets × USDGBP
+ ECB Assets × USDEUR
– Fed RRP (FRED: RRPONTSYD)
– Treasury General Account (FRED: WTREGEN)
All series are converted to USD and summed on a daily basis.
What’s new in this version
Plot Offset – Shift the curve forward or backward ±500 trading days (positive = future) to visualise the commonly cited 10 to 12 week lead/lag between liquidity and equity indices.
Optional Smoothing – Apply either a Simple Moving Average (SMA) or Exponential Moving Average (EMA) of any length to damp daily noise and focus on structural turns.
How to use it
- Add the script to a separate pane on a daily-time-frame chart (e.g., SPX, BTC-USD).
- Adjust Plot Offset until major peaks/troughs in liquidity line up with market turns; many traders start near +50 trading days.
- Optionally Toggle Apply Smoothing and choose SMA or EMA when abrupt central-bank balance-sheet moves create visual “spikes.”
Credits & licence
Originally published as “Global Net Liquidity” by dharmatech under the Mozilla Public License 2.0. This fork by LabOfCrypto adds offset and smoothing, plus minor usability tweaks. It remains open-source under the MPL-2.0.
Disclaimer
For educational purposes only. Past liquidity patterns do not guarantee future market behaviour; always combine with sound risk management.
オープンソーススクリプト
TradingViewの精神に則り、このスクリプトの作者はコードをオープンソースとして公開してくれました。トレーダーが内容を確認・検証できるようにという配慮です。作者に拍手を送りましょう!無料で利用できますが、コードの再公開はハウスルールに従う必要があります。
免責事項
この情報および投稿は、TradingViewが提供または推奨する金融、投資、トレード、その他のアドバイスや推奨を意図するものではなく、それらを構成するものでもありません。詳細は利用規約をご覧ください。
オープンソーススクリプト
TradingViewの精神に則り、このスクリプトの作者はコードをオープンソースとして公開してくれました。トレーダーが内容を確認・検証できるようにという配慮です。作者に拍手を送りましょう!無料で利用できますが、コードの再公開はハウスルールに従う必要があります。
免責事項
この情報および投稿は、TradingViewが提供または推奨する金融、投資、トレード、その他のアドバイスや推奨を意図するものではなく、それらを構成するものでもありません。詳細は利用規約をご覧ください。