OPEN-SOURCE SCRIPT
更新済 SymMatrixTable
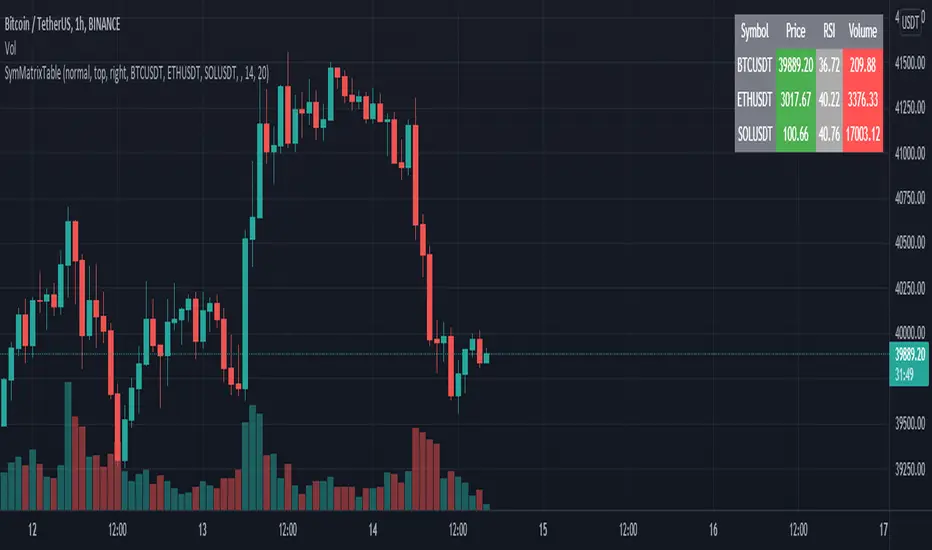
Simple Example Table for Displaying Price, RSI, Volume of multiple Tickers on selected Timeframe
Displays Price, RSI and Volume of 3 Tickers and Timeframe selected by user input
Conditional Table Cell coloring
Price color green if > than previous candle close and red if < previous candle close
RSI color green if < 30 and red if > 70 (RSI14 by default)
Volume color green if above average volume and red if less than that (SMA20 volume by default)
Can turn on/off whole table, header columns, row indices, or select individual columns or rows to show/hide
// Example Mixed Type Matrix To Table //
access the simple example script by uncommenting the code at the end
Basically I wanted to have the headers and indices as strings and the rest of the matrix for the table body as floats, then conditional coloring on the table cells
And also the functionality to turn rows and columns on/off from table through checkboxes of user input
Before I was storing each of the values separately in arrays that didn't have a centralized way of controlling table structure
so now the structure is :
- string header array, string index array
- float matrix for table body
- color matrix with bool conditions for coloring table cells
- bool checkboxes for controlling table display
リリースノート
Updated example code description comments for better readability/simplicityNo changes to script functionality
オープンソーススクリプト
TradingViewの精神に則り、このスクリプトの作者はコードをオープンソースとして公開してくれました。トレーダーが内容を確認・検証できるようにという配慮です。作者に拍手を送りましょう!無料で利用できますが、コードの再公開はハウスルールに従う必要があります。
免責事項
この情報および投稿は、TradingViewが提供または推奨する金融、投資、トレード、その他のアドバイスや推奨を意図するものではなく、それらを構成するものでもありません。詳細は利用規約をご覧ください。
オープンソーススクリプト
TradingViewの精神に則り、このスクリプトの作者はコードをオープンソースとして公開してくれました。トレーダーが内容を確認・検証できるようにという配慮です。作者に拍手を送りましょう!無料で利用できますが、コードの再公開はハウスルールに従う必要があります。
免責事項
この情報および投稿は、TradingViewが提供または推奨する金融、投資、トレード、その他のアドバイスや推奨を意図するものではなく、それらを構成するものでもありません。詳細は利用規約をご覧ください。