OPEN-SOURCE SCRIPT
RSI Trending with Divergences
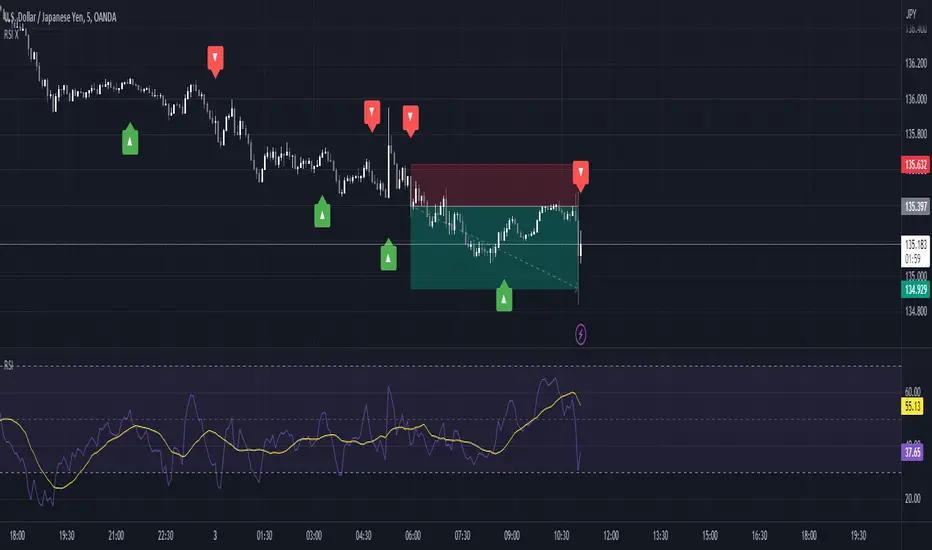
This script uses the RSI and RSI divergences to mark signals where the rsi is both below/above the 50, below/above its moving average, and where the last regular or hidden divergence matches that state. The RSI is built into the indicator, so you don't need it in your bottom pane if you don't want it, I just put one there for illustrative purposes. Please note it will not print the same signal consecutively, as it is meant to show an overall direction, not the in and out fluctuations. I suggest using it in conjunction with some moving averages so you can ignore signals not in the trend.
オープンソーススクリプト
TradingViewの精神に則り、このスクリプトの作者はコードをオープンソースとして公開してくれました。トレーダーが内容を確認・検証できるようにという配慮です。作者に拍手を送りましょう!無料で利用できますが、コードの再公開はハウスルールに従う必要があります。
免責事項
この情報および投稿は、TradingViewが提供または推奨する金融、投資、トレード、その他のアドバイスや推奨を意図するものではなく、それらを構成するものでもありません。詳細は利用規約をご覧ください。
オープンソーススクリプト
TradingViewの精神に則り、このスクリプトの作者はコードをオープンソースとして公開してくれました。トレーダーが内容を確認・検証できるようにという配慮です。作者に拍手を送りましょう!無料で利用できますが、コードの再公開はハウスルールに従う必要があります。
免責事項
この情報および投稿は、TradingViewが提供または推奨する金融、投資、トレード、その他のアドバイスや推奨を意図するものではなく、それらを構成するものでもありません。詳細は利用規約をご覧ください。