OPEN-SOURCE SCRIPT
更新済 Overlay Candles (Multi-TF, right side projection)

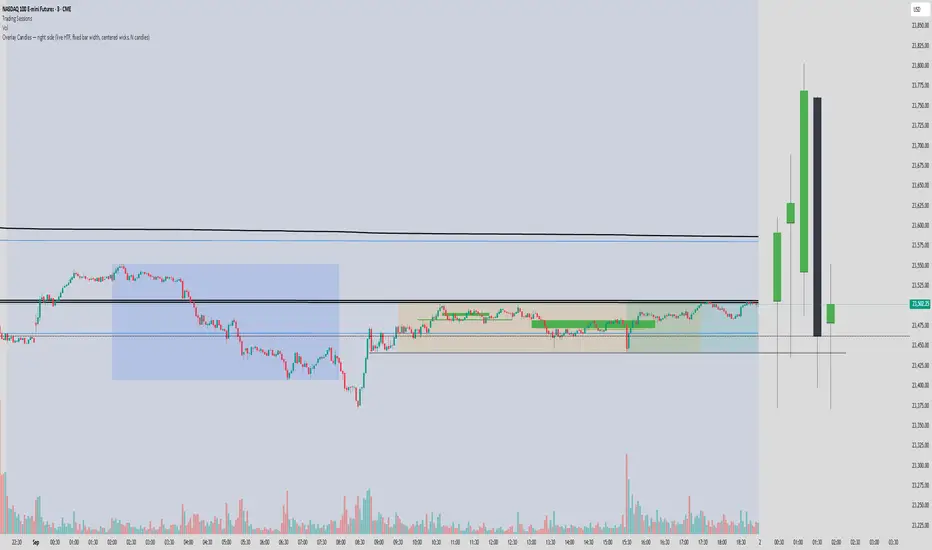
This script overlays candles from a custom selectable timeframe (5m to 1M) on the right side of the chart as projections.
It helps visualize and compare the ongoing price action with the last higher-timeframe candles without switching chart intervals.
Features:
Choose timeframe for overlay candles (5m, 15m, 1H, 4H, 1D, 1W, 1M).
Adjustable number of candles to display (1–8).
Fixed candle width (in bars) and configurable gap between candles.
Custom colors for bullish and bearish candles.
Adjustable wick and border thickness (px).
Candle borders drawn with four lines to ensure visibility at all zoom levels.
Use cases:
Multi-timeframe price action analysis.
Visualizing higher-timeframe structure alongside lower-timeframe trading.
Educational / visual aid for understanding candlestick context.
リリースノート
This script overlays candles from a custom selectable timeframe (5m to 1M) on the right side of the chart as projections.It helps visualize and compare the ongoing price action with the last higher-timeframe candles without switching chart intervals.
Features:
Choose timeframe for overlay candles (5m, 15m, 1H, 4H, 1D, 1W, 1M).
Adjustable number of candles to display (1–8).
Fixed candle width (in bars) and configurable gap between candles.
Custom colors for bullish and bearish candles.
Adjustable wick and border thickness (px).
Candle borders drawn with four lines to ensure visibility at all zoom levels.
Use cases:
Multi-timeframe price action analysis.
Visualizing higher-timeframe structure alongside lower-timeframe trading.
Educational / visual aid for understanding candlestick context.
オープンソーススクリプト
TradingViewの精神に則り、このスクリプトの作者はコードをオープンソースとして公開してくれました。トレーダーが内容を確認・検証できるようにという配慮です。作者に拍手を送りましょう!無料で利用できますが、コードの再公開はハウスルールに従う必要があります。
免責事項
この情報および投稿は、TradingViewが提供または推奨する金融、投資、トレード、その他のアドバイスや推奨を意図するものではなく、それらを構成するものでもありません。詳細は利用規約をご覧ください。
オープンソーススクリプト
TradingViewの精神に則り、このスクリプトの作者はコードをオープンソースとして公開してくれました。トレーダーが内容を確認・検証できるようにという配慮です。作者に拍手を送りましょう!無料で利用できますが、コードの再公開はハウスルールに従う必要があります。
免責事項
この情報および投稿は、TradingViewが提供または推奨する金融、投資、トレード、その他のアドバイスや推奨を意図するものではなく、それらを構成するものでもありません。詳細は利用規約をご覧ください。