OPEN-SOURCE SCRIPT
更新済 Dynamic Candle Strength
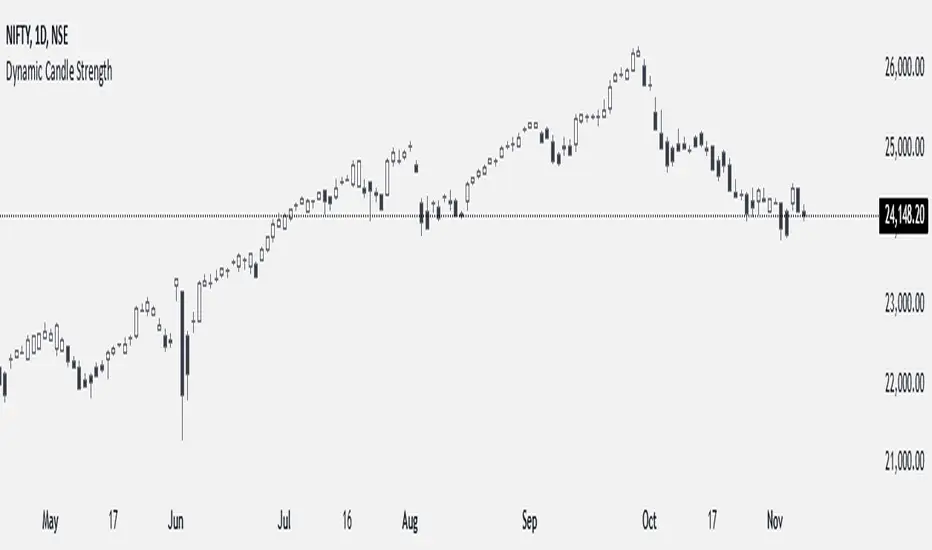
How It Works
Initialization of Dynamic Levels:
The first candle's high and low are taken as the initial dynamic high and dynamic low levels.
If the next candle's close price is above the dynamic high, the candle is colored green, indicating bullish conditions.
If the next candle's close price is below the dynamic low, the candle is colored black, indicating bearish conditions.
If a candle's high and low crossed both the dynamic high and dynamic low, the dynamic high and low levels are updated to the high and low of that candle, but the candle color will continue with the same color as the previous candle.
Maintaining and Updating Dynamic Levels:
The dynamic high and low are only updated if a candle's close is above the current dynamic high or below the current dynamic low.
If the candle does not close above or below these levels, the dynamic high and low remain unchanged.
Visual Signals:
Green Bars: Indicate that the candle's close is above the dynamic high, suggesting bullish conditions.
Black Bars: Indicate that the candle's close is below the dynamic low, suggesting bearish conditions.
This method ensures that the dynamic high and low levels are adjusted in real-time based on the most recent significant price movements, providing a reliable measure of market sentiment.
リリースノート
Dynamic Variables: The script defines dynamicHigh, dynamicLow, dynamicOpen, and dynamicClose to track the high, low, open, and close values of candles.Update Dynamic Values: Dynamic values are updated based on the close price. If dynamicHigh or dynamicLow is na, or if the current close breaches either threshold, the values are set to the current candle's high, low, open, and close.
Determine Bullish and Bearish Conditions: The script checks if dynamicClose is less than dynamicOpen to identify bearish conditions or if dynamicClose is greater than dynamicOpen for bullish conditions.
Bar Color: Bars are colored green when dynamicClose is greater than dynamicOpen, indicating a bullish condition, and red when it is less, indicating a bearish condition.
リリースノート
The previous version was not able to handle gap-up or gap-down situations, so those conditions have been added.リリースノート
The previous version was not able to handle gap-up or gap-down situations, so those conditions have been added.オープンソーススクリプト
TradingViewの精神に則り、このスクリプトの作者はコードをオープンソースとして公開してくれました。トレーダーが内容を確認・検証できるようにという配慮です。作者に拍手を送りましょう!無料で利用できますが、コードの再公開はハウスルールに従う必要があります。
Sreenureddy
免責事項
この情報および投稿は、TradingViewが提供または推奨する金融、投資、トレード、その他のアドバイスや推奨を意図するものではなく、それらを構成するものでもありません。詳細は利用規約をご覧ください。
オープンソーススクリプト
TradingViewの精神に則り、このスクリプトの作者はコードをオープンソースとして公開してくれました。トレーダーが内容を確認・検証できるようにという配慮です。作者に拍手を送りましょう!無料で利用できますが、コードの再公開はハウスルールに従う必要があります。
Sreenureddy
免責事項
この情報および投稿は、TradingViewが提供または推奨する金融、投資、トレード、その他のアドバイスや推奨を意図するものではなく、それらを構成するものでもありません。詳細は利用規約をご覧ください。