OPEN-SOURCE SCRIPT
J Weighted Average Price
📘 How to Use the OBV VWAP Reentry Signal Effectively
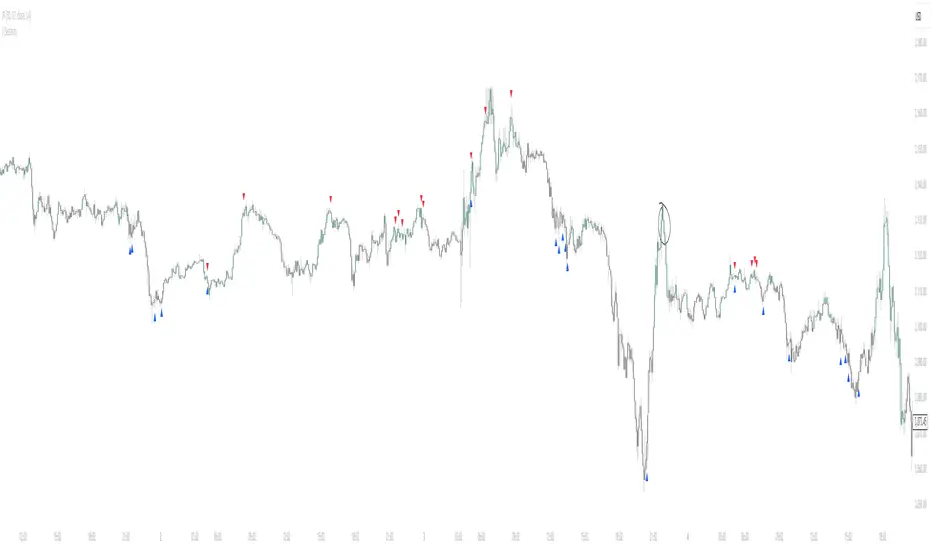
This indicator plots a VWAP based on OBV (On-Balance Volume), along with dynamic bands to identify overbought and oversold conditions in volume flow.
🔺 Red Triangle Up: Appears when OBV crosses back below the upper band → Potential reversal from overbought → Watch for short opportunities.
🔻 Blue Triangle Down: Appears when OBV crosses back above the lower band → Potential reversal from oversold → Watch for long opportunities.
📌 Tip: Use these signals in confluence with price action or trend confirmation to filter false signals. For example:
Enter short after a reentry from upper band and a lower high in price.
Enter long after a reentry from lower band and a bullish candle structure.
This setup helps you catch mean reversion moves based on volume flow, not just price.
オープンソーススクリプト
TradingViewの精神に則り、このスクリプトの作者はコードをオープンソースとして公開してくれました。トレーダーが内容を確認・検証できるようにという配慮です。作者に拍手を送りましょう!無料で利用できますが、コードの再公開はハウスルールに従う必要があります。
免責事項
この情報および投稿は、TradingViewが提供または推奨する金融、投資、トレード、その他のアドバイスや推奨を意図するものではなく、それらを構成するものでもありません。詳細は利用規約をご覧ください。
オープンソーススクリプト
TradingViewの精神に則り、このスクリプトの作者はコードをオープンソースとして公開してくれました。トレーダーが内容を確認・検証できるようにという配慮です。作者に拍手を送りましょう!無料で利用できますが、コードの再公開はハウスルールに従う必要があります。
免責事項
この情報および投稿は、TradingViewが提供または推奨する金融、投資、トレード、その他のアドバイスや推奨を意図するものではなく、それらを構成するものでもありません。詳細は利用規約をご覧ください。