OPEN-SOURCE SCRIPT
更新済 Large volume indicator to show the price above/below
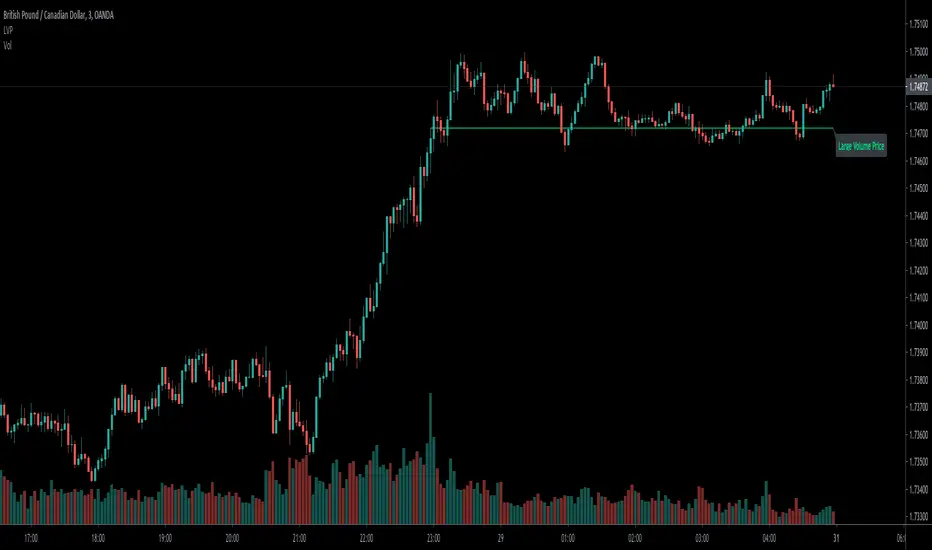
Large volume is meaningful that usually the current price above the highest price of the bars with largest volume usually means uptrend in the short-term.
In the opposite, below it means downtrend.
I coded this indicator to save the efforts to compare it, make it easily to tell the uptrend/downtrend by above/below and color.
Hope you guys enjoy it, and welcome to comment.
The Inputs:
Length:the largest volume of bars of the total bars numbers.
Color:the above/below colors.
Text:Remind this line is large volume R/S.
You can find the video tutorial in my ideas sharing.
リリースノート
Hi,Guys,According to feedbacks of invisible,
1.I move the label to the right.
2.The background color of label can be self-defined.
3.Make the line thicker.
Thanks for comment and share how you feel when using it.
リリースノート
Hi,guys,According to feedback of indicator, some modified functions as below:
1.Self-defined extend the line to the left largest volume bar or not.(Default is yes)
2.Self-defined the width of line (1-4) to be visible.(Default is 1, thinnest)
Hope you guys enjoy it, and welcome to leave your comments below.
Thanks.
オープンソーススクリプト
TradingViewの精神に則り、このスクリプトの作者はコードをオープンソースとして公開してくれました。トレーダーが内容を確認・検証できるようにという配慮です。作者に拍手を送りましょう!無料で利用できますが、コードの再公開はハウスルールに従う必要があります。
免責事項
この情報および投稿は、TradingViewが提供または推奨する金融、投資、トレード、その他のアドバイスや推奨を意図するものではなく、それらを構成するものでもありません。詳細は利用規約をご覧ください。
オープンソーススクリプト
TradingViewの精神に則り、このスクリプトの作者はコードをオープンソースとして公開してくれました。トレーダーが内容を確認・検証できるようにという配慮です。作者に拍手を送りましょう!無料で利用できますが、コードの再公開はハウスルールに従う必要があります。
免責事項
この情報および投稿は、TradingViewが提供または推奨する金融、投資、トレード、その他のアドバイスや推奨を意図するものではなく、それらを構成するものでもありません。詳細は利用規約をご覧ください。