OPEN-SOURCE SCRIPT
SMA200 & RSI [Tarun]
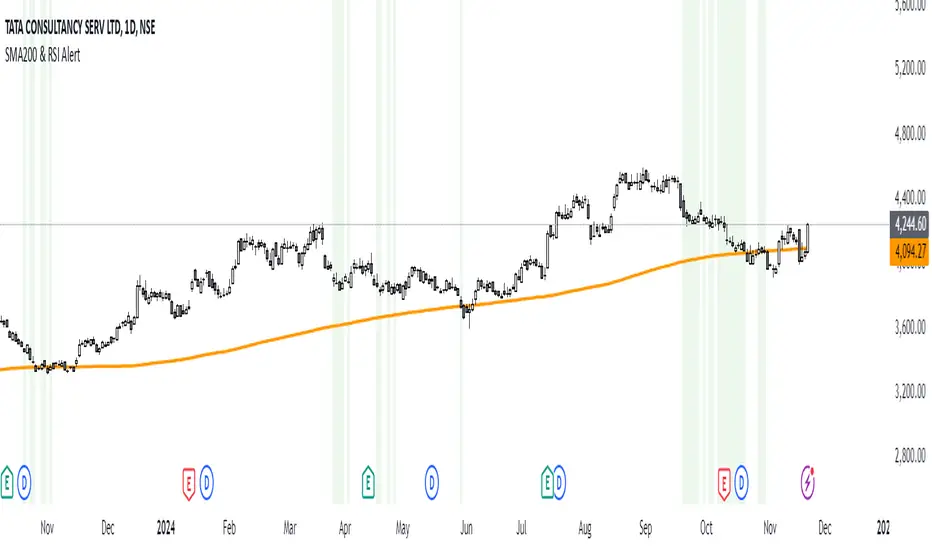
The SMA200 & RSI Signal Indicator is a powerful tool designed for traders who want to identify potential entry zones based on a combination of price action and momentum. This indicator combines two essential trading components:
How It Works:
When both conditions are met, the indicator triggers:
Disclaimer:
- SMA200 (Simple Moving Average): A widely used trend-following tool that highlights the overall direction of the market.
- RSI (Relative Strength Index): A momentum oscillator that measures the speed and change of price movements.
How It Works:
- Price Above SMA200: Indicates bullish market conditions.
- RSI Between 40 and 20: Suggests that the asset is in a potential oversold or pullback zone within a bullish trend.
When both conditions are met, the indicator triggers:
- Background Highlight: The chart background turns green to indicate a potential signal zone.
Disclaimer:
This indicator is not a standalone trading strategy. Use it in conjunction with other analysis methods such as support and resistance, candlestick patterns, or volume analysis. Always practice proper risk management.
オープンソーススクリプト
TradingViewの精神に則り、このスクリプトの作者はコードをオープンソースとして公開してくれました。トレーダーが内容を確認・検証できるようにという配慮です。作者に拍手を送りましょう!無料で利用できますが、コードの再公開はハウスルールに従う必要があります。
免責事項
この情報および投稿は、TradingViewが提供または推奨する金融、投資、トレード、その他のアドバイスや推奨を意図するものではなく、それらを構成するものでもありません。詳細は利用規約をご覧ください。
オープンソーススクリプト
TradingViewの精神に則り、このスクリプトの作者はコードをオープンソースとして公開してくれました。トレーダーが内容を確認・検証できるようにという配慮です。作者に拍手を送りましょう!無料で利用できますが、コードの再公開はハウスルールに従う必要があります。
免責事項
この情報および投稿は、TradingViewが提供または推奨する金融、投資、トレード、その他のアドバイスや推奨を意図するものではなく、それらを構成するものでもありません。詳細は利用規約をご覧ください。