OPEN-SOURCE SCRIPT
ATR Bands over 50D SMA (% method)
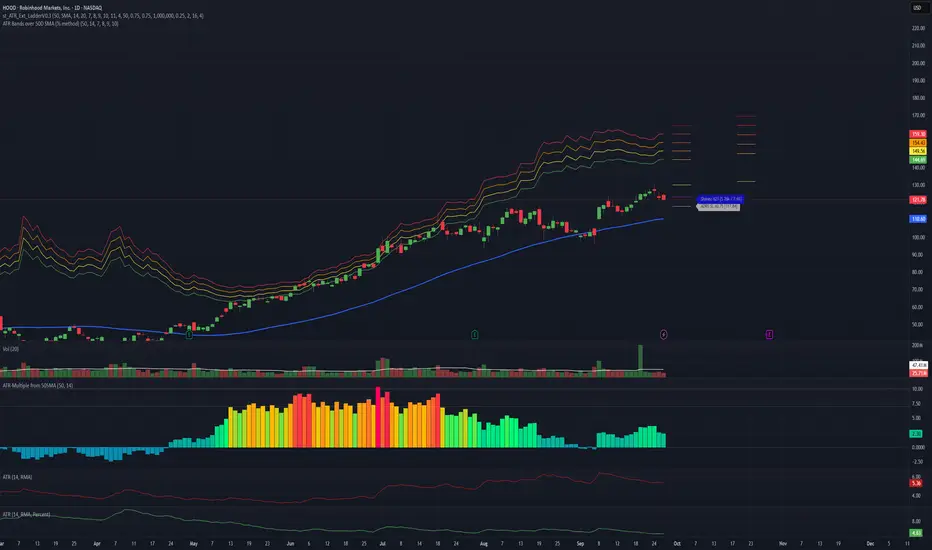
Indicator that shows multiples of ATR% above the 50d SMA as bands on a chart, building off of
Jeff Sun 's methodology. You should tinker with the settings to chose your multiples, colors and which multiple lines to show. I don't know if the negative multiple lines have any use, so I turn mine off. Offered as is. I am not a programmer. Note the other indicators shown on the print screen are not mine.
Jeff Sun 's methodology. You should tinker with the settings to chose your multiples, colors and which multiple lines to show. I don't know if the negative multiple lines have any use, so I turn mine off. Offered as is. I am not a programmer. Note the other indicators shown on the print screen are not mine.
オープンソーススクリプト
TradingViewの精神に則り、このスクリプトの作者はコードをオープンソースとして公開してくれました。トレーダーが内容を確認・検証できるようにという配慮です。作者に拍手を送りましょう!無料で利用できますが、コードの再公開はハウスルールに従う必要があります。
免責事項
この情報および投稿は、TradingViewが提供または推奨する金融、投資、トレード、その他のアドバイスや推奨を意図するものではなく、それらを構成するものでもありません。詳細は利用規約をご覧ください。
オープンソーススクリプト
TradingViewの精神に則り、このスクリプトの作者はコードをオープンソースとして公開してくれました。トレーダーが内容を確認・検証できるようにという配慮です。作者に拍手を送りましょう!無料で利用できますが、コードの再公開はハウスルールに従う必要があります。
免責事項
この情報および投稿は、TradingViewが提供または推奨する金融、投資、トレード、その他のアドバイスや推奨を意図するものではなく、それらを構成するものでもありません。詳細は利用規約をご覧ください。