Hello All,
This is an experimental work to show 10 moving averages in 3D by using linefill.new() feature of the Pine language.
You can set moving average type as Simple (SMA) or Exponential (EMA)
You can set "Starting Length" and set the "Step" to calculate other lengths. For example; if "Starting Length" is 10 and "step" is 5 then the lengths are 10, 15, 20, 25...
You can set the colors as Red, Green, Blue for each direction. And you can change the width. you can see the examples below
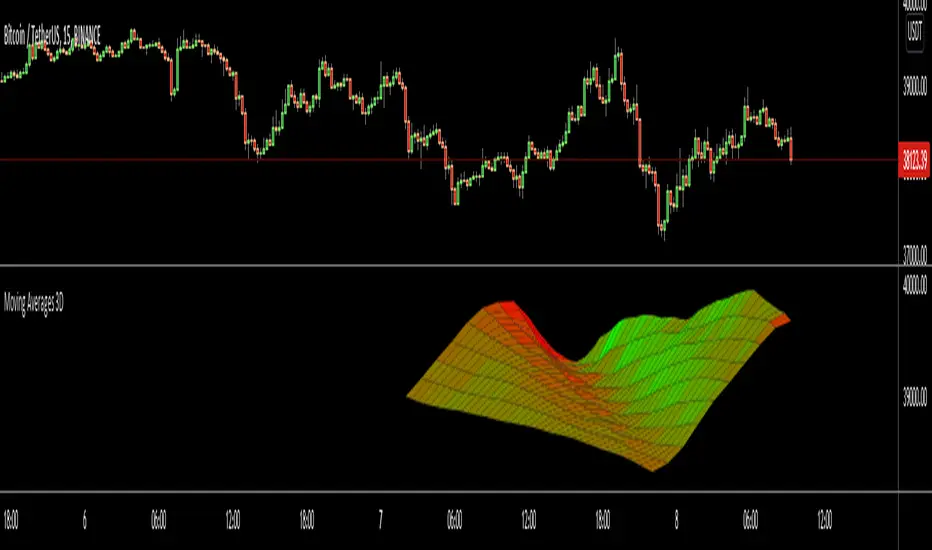
In following example Green and Blue used:

In following example Blue and Red is used and Width is set as 5:

Enjoy!
This is an experimental work to show 10 moving averages in 3D by using linefill.new() feature of the Pine language.
You can set moving average type as Simple (SMA) or Exponential (EMA)
You can set "Starting Length" and set the "Step" to calculate other lengths. For example; if "Starting Length" is 10 and "step" is 5 then the lengths are 10, 15, 20, 25...
You can set the colors as Red, Green, Blue for each direction. And you can change the width. you can see the examples below
In following example Green and Blue used:
In following example Blue and Red is used and Width is set as 5:
Enjoy!
リリースノート
Drawing order and 3d display improvedオープンソーススクリプト
TradingViewの精神に則り、このスクリプトの作者はコードをオープンソースとして公開してくれました。トレーダーが内容を確認・検証できるようにという配慮です。作者に拍手を送りましょう!無料で利用できますが、コードの再公開はハウスルールに従う必要があります。
🤝 LonesomeTheBlue community
t.me/LonesomeTheBlue_Official
🎦 YouTube Channel
Youtube.com/@lonesometheblue/videos
💰 Subscription to Pro indicators
Tradingview.com/spaces/LonesomeTheBlue/
t.me/LonesomeTheBlue_Official
🎦 YouTube Channel
Youtube.com/@lonesometheblue/videos
💰 Subscription to Pro indicators
Tradingview.com/spaces/LonesomeTheBlue/
免責事項
この情報および投稿は、TradingViewが提供または推奨する金融、投資、トレード、その他のアドバイスや推奨を意図するものではなく、それらを構成するものでもありません。詳細は利用規約をご覧ください。
オープンソーススクリプト
TradingViewの精神に則り、このスクリプトの作者はコードをオープンソースとして公開してくれました。トレーダーが内容を確認・検証できるようにという配慮です。作者に拍手を送りましょう!無料で利用できますが、コードの再公開はハウスルールに従う必要があります。
🤝 LonesomeTheBlue community
t.me/LonesomeTheBlue_Official
🎦 YouTube Channel
Youtube.com/@lonesometheblue/videos
💰 Subscription to Pro indicators
Tradingview.com/spaces/LonesomeTheBlue/
t.me/LonesomeTheBlue_Official
🎦 YouTube Channel
Youtube.com/@lonesometheblue/videos
💰 Subscription to Pro indicators
Tradingview.com/spaces/LonesomeTheBlue/
免責事項
この情報および投稿は、TradingViewが提供または推奨する金融、投資、トレード、その他のアドバイスや推奨を意図するものではなく、それらを構成するものでもありません。詳細は利用規約をご覧ください。