OPEN-SOURCE SCRIPT
Normalized MACD with RSI [bkeevil]
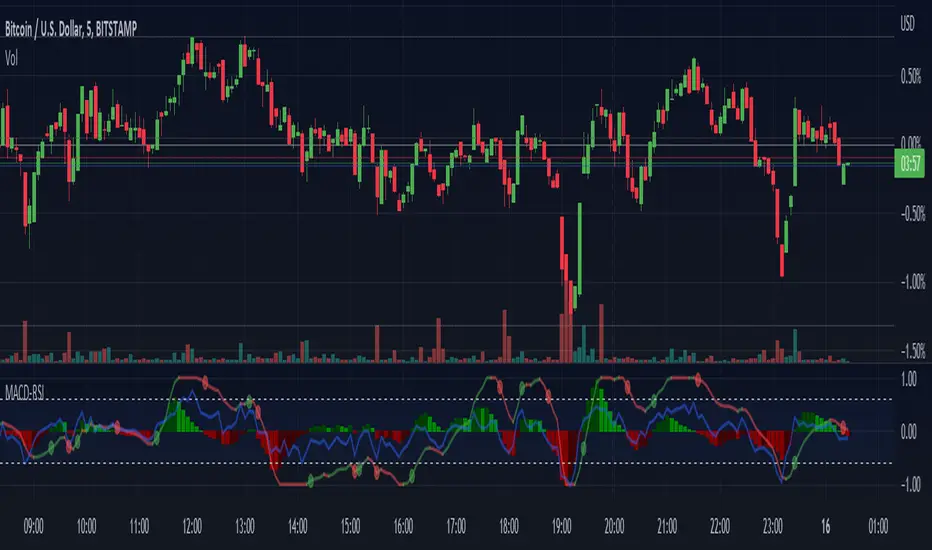
This indicator normalizes the MACD and RSI indicators to a range between -1.0 and 1.0 so they can be displayed together on the same chart to save screen real-estate.
While the MACD is a good indicator to detect trend changes, in some circumstances (such as a sideways range market) it can give false signals. The MACD is more likely to give a false signal when the RSI indicator is close to the centerline than if the RSI is signaling an overbought or oversold condition. Thus the RSI indicator and MACD indicator are commonly used together.
I have included a few features found in other MACD indicators that I have found helpful:
The MACD signal line is hidden it by default as the information it contains is redundant. Hiding the signal line makes the indicator less busy.
While the MACD is a good indicator to detect trend changes, in some circumstances (such as a sideways range market) it can give false signals. The MACD is more likely to give a false signal when the RSI indicator is close to the centerline than if the RSI is signaling an overbought or oversold condition. Thus the RSI indicator and MACD indicator are commonly used together.
I have included a few features found in other MACD indicators that I have found helpful:
- MACD line changes color if it is rising or falling
- Dots at the MACD line to signal crossovers
The MACD signal line is hidden it by default as the information it contains is redundant. Hiding the signal line makes the indicator less busy.
オープンソーススクリプト
TradingViewの精神に則り、このスクリプトの作者はコードをオープンソースとして公開してくれました。トレーダーが内容を確認・検証できるようにという配慮です。作者に拍手を送りましょう!無料で利用できますが、コードの再公開はハウスルールに従う必要があります。
免責事項
この情報および投稿は、TradingViewが提供または推奨する金融、投資、トレード、その他のアドバイスや推奨を意図するものではなく、それらを構成するものでもありません。詳細は利用規約をご覧ください。
オープンソーススクリプト
TradingViewの精神に則り、このスクリプトの作者はコードをオープンソースとして公開してくれました。トレーダーが内容を確認・検証できるようにという配慮です。作者に拍手を送りましょう!無料で利用できますが、コードの再公開はハウスルールに従う必要があります。
免責事項
この情報および投稿は、TradingViewが提供または推奨する金融、投資、トレード、その他のアドバイスや推奨を意図するものではなく、それらを構成するものでもありません。詳細は利用規約をご覧ください。