OPEN-SOURCE SCRIPT
Volume Stack Emojis

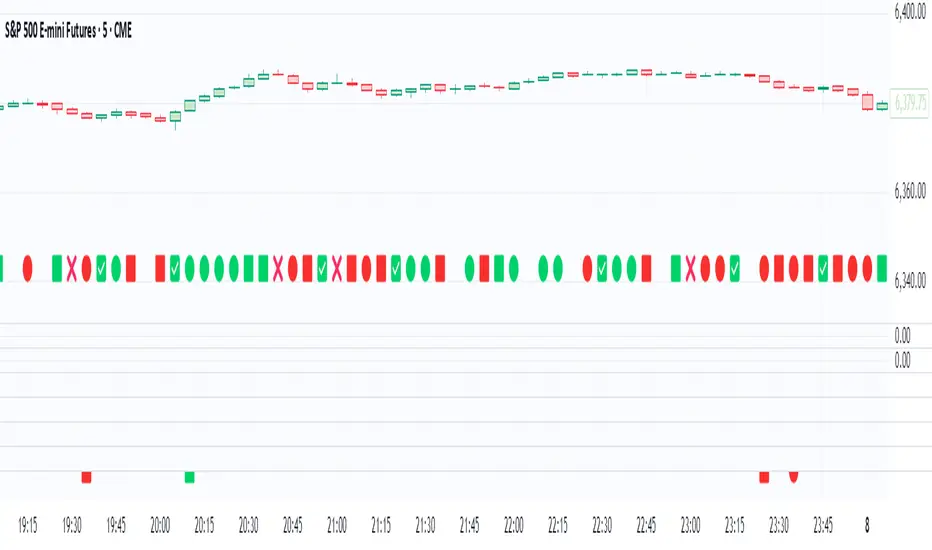
Volume Stack visualizes market bias and momentum for each candle using intuitive emojis in a dedicated bottom pane, keeping your main price chart clean and focused. The indicator analyzes where price closes within each bar’s range to estimate bullish or bearish pressure and highlights key momentum shifts.
Features:
Bullish and Bearish States:
🟩 Green square: Normal bullish candle
🟥 Red square: Normal bearish candle
Strong Bullish/Bearish:
🟢 Green circle: Strong bullish (close near high)
🔴 Red circle: Strong bearish (close near low)
Critical Transitions:
✅ Green checkmark: Bearish → strong bullish (momentum reversal up)
❌ Red cross: Bullish → strong bearish (momentum reversal down)
Easy Visual Scanning:
Emojis plotted in the indicator’s own pane for rapid pattern recognition and clean workflow.
No overlays:
Keeps all symbols off the main price pane.
How it works:
For each candle, the indicator calculates the percentage distance of the close price within the high/low range, then classifies and marks:
Normal bullish/bearish: Basic directional bias
Strong signals: Close is at least 75% toward the high (bullish) or low (bearish)
Transitions: Detects when the market suddenly flips from bullish to strong bearish (❌), or bearish to strong bullish (✅), pinpointing possible inflection points.
This indicator is ideal for traders who want a simple, non-intrusive visualization of intrabar momentum and key reversals—making trend reading and market sentiment effortless.
オープンソーススクリプト
TradingViewの精神に則り、このスクリプトの作者はコードをオープンソースとして公開してくれました。トレーダーが内容を確認・検証できるようにという配慮です。作者に拍手を送りましょう!無料で利用できますが、コードの再公開はハウスルールに従う必要があります。
免責事項
この情報および投稿は、TradingViewが提供または推奨する金融、投資、トレード、その他のアドバイスや推奨を意図するものではなく、それらを構成するものでもありません。詳細は利用規約をご覧ください。
オープンソーススクリプト
TradingViewの精神に則り、このスクリプトの作者はコードをオープンソースとして公開してくれました。トレーダーが内容を確認・検証できるようにという配慮です。作者に拍手を送りましょう!無料で利用できますが、コードの再公開はハウスルールに従う必要があります。
免責事項
この情報および投稿は、TradingViewが提供または推奨する金融、投資、トレード、その他のアドバイスや推奨を意図するものではなく、それらを構成するものでもありません。詳細は利用規約をご覧ください。