OPEN-SOURCE SCRIPT
Parabolic SAR BY CARLOZ
🔹 What is the Parabolic SAR?
The Parabolic SAR (developed by Welles Wilder) is a trend-following indicator used to identify potential entry and exit points in the market.
🔹 What does “SAR” mean?
SAR = Stop And Reverse.
It suggests where to place a stop loss and also indicates when to reverse a position (from long to short or short to long).
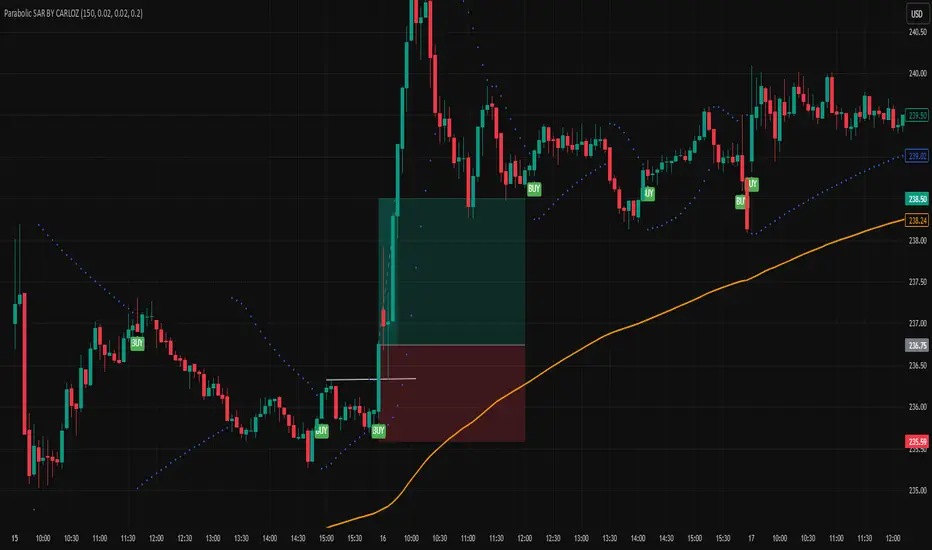
🔹 How does it look on the chart?
It appears as a series of dots above or below the price:
Dots below price → bullish signal (uptrend).
Dots above price → bearish signal (downtrend).
The Parabolic SAR (developed by Welles Wilder) is a trend-following indicator used to identify potential entry and exit points in the market.
🔹 What does “SAR” mean?
SAR = Stop And Reverse.
It suggests where to place a stop loss and also indicates when to reverse a position (from long to short or short to long).
🔹 How does it look on the chart?
It appears as a series of dots above or below the price:
Dots below price → bullish signal (uptrend).
Dots above price → bearish signal (downtrend).
オープンソーススクリプト
TradingViewの精神に則り、このスクリプトの作者はコードをオープンソースとして公開してくれました。トレーダーが内容を確認・検証できるようにという配慮です。作者に拍手を送りましょう!無料で利用できますが、コードの再公開はハウスルールに従う必要があります。
免責事項
この情報および投稿は、TradingViewが提供または推奨する金融、投資、トレード、その他のアドバイスや推奨を意図するものではなく、それらを構成するものでもありません。詳細は利用規約をご覧ください。
オープンソーススクリプト
TradingViewの精神に則り、このスクリプトの作者はコードをオープンソースとして公開してくれました。トレーダーが内容を確認・検証できるようにという配慮です。作者に拍手を送りましょう!無料で利用できますが、コードの再公開はハウスルールに従う必要があります。
免責事項
この情報および投稿は、TradingViewが提供または推奨する金融、投資、トレード、その他のアドバイスや推奨を意図するものではなく、それらを構成するものでもありません。詳細は利用規約をご覧ください。