OPEN-SOURCE SCRIPT
Star of David Drawing-AYNET
Explanation of Code
Settings:
centerTime defines the center time for the star pattern, defaulting to January 1, 2023.
centerPrice is the center Y-axis level for positioning the star.
size controls the overall size of the star.
starColor and lineWidth allow customization of the color and thickness of the lines.
Utility Function:
toRadians converts degrees to radians, though it’s not directly used here, it might be useful for future adjustments to angles.
Star of David Drawing Function:
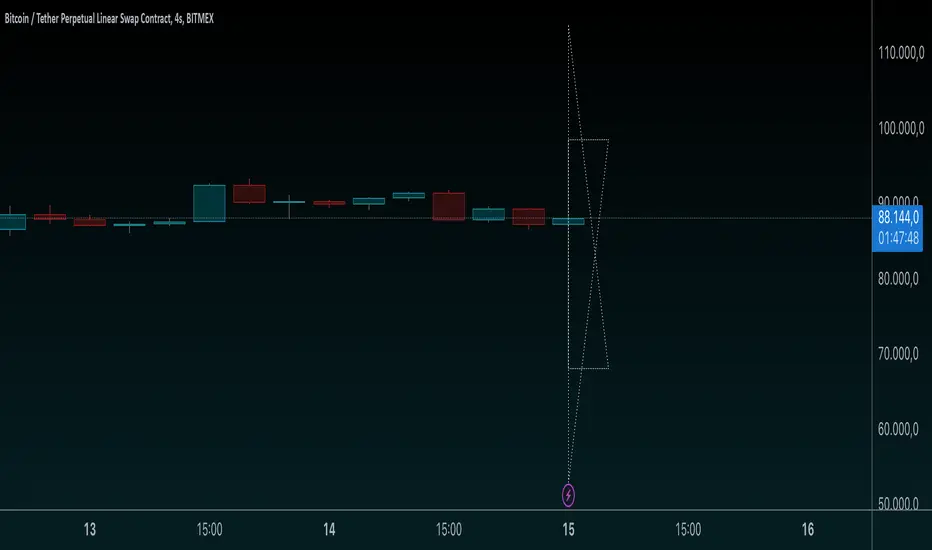
The drawStarOfDavid function calculates the position of each point on the star relative to the center coordinates (centerTime, centerY) and size.
The pattern has six key points that form two overlapping triangles, creating the Star of David pattern.
The time offsets (offset1 and offset2) determine the horizontal spread of the star, scaling according to size.
The line.new function is used to draw the star lines with the calculated coordinates, casting timestamps to int to comply with line.new requirements.
Star Rendering:
Finally, drawStarOfDavid is called to render the Star of David pattern on the chart based on the input parameters.
This code draws the Star of David on a chart at a specified time and price level, with customizable size, color, and line width. Adjust centerTime, centerPrice, and size as needed for different star placements on the chart.
Settings:
centerTime defines the center time for the star pattern, defaulting to January 1, 2023.
centerPrice is the center Y-axis level for positioning the star.
size controls the overall size of the star.
starColor and lineWidth allow customization of the color and thickness of the lines.
Utility Function:
toRadians converts degrees to radians, though it’s not directly used here, it might be useful for future adjustments to angles.
Star of David Drawing Function:
The drawStarOfDavid function calculates the position of each point on the star relative to the center coordinates (centerTime, centerY) and size.
The pattern has six key points that form two overlapping triangles, creating the Star of David pattern.
The time offsets (offset1 and offset2) determine the horizontal spread of the star, scaling according to size.
The line.new function is used to draw the star lines with the calculated coordinates, casting timestamps to int to comply with line.new requirements.
Star Rendering:
Finally, drawStarOfDavid is called to render the Star of David pattern on the chart based on the input parameters.
This code draws the Star of David on a chart at a specified time and price level, with customizable size, color, and line width. Adjust centerTime, centerPrice, and size as needed for different star placements on the chart.
オープンソーススクリプト
TradingViewの精神に則り、このスクリプトの作者はコードをオープンソースとして公開してくれました。トレーダーが内容を確認・検証できるようにという配慮です。作者に拍手を送りましょう!無料で利用できますが、コードの再公開はハウスルールに従う必要があります。
免責事項
この情報および投稿は、TradingViewが提供または推奨する金融、投資、トレード、その他のアドバイスや推奨を意図するものではなく、それらを構成するものでもありません。詳細は利用規約をご覧ください。
オープンソーススクリプト
TradingViewの精神に則り、このスクリプトの作者はコードをオープンソースとして公開してくれました。トレーダーが内容を確認・検証できるようにという配慮です。作者に拍手を送りましょう!無料で利用できますが、コードの再公開はハウスルールに従う必要があります。
免責事項
この情報および投稿は、TradingViewが提供または推奨する金融、投資、トレード、その他のアドバイスや推奨を意図するものではなく、それらを構成するものでもありません。詳細は利用規約をご覧ください。