OPEN-SOURCE SCRIPT
更新済 Heiken Ashi Lower Pane
Not one of my more challenging scripts, never the less I was requested to publish this open source indicator.
Heiken Ashi (HA) candles indicate strength usually when the candles have wicks in the direction of the movement, ie. top wicks on green candles w/NO wicks on bottom and vice versa for bearish behavior (bottom wicks on red candles). Weakness in the movement CAN be spotted by watching for wicks opposite the movement appearing.
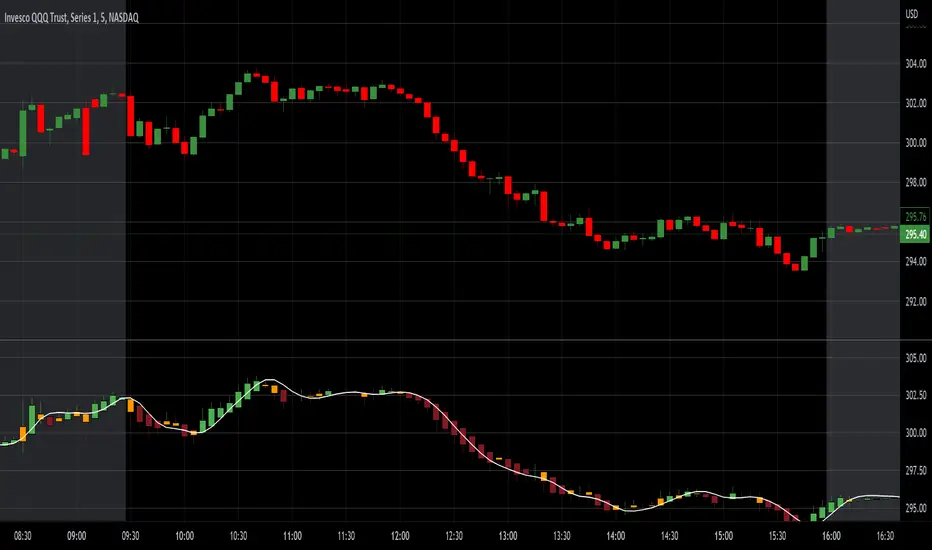
This indicator can be used in a lower pane to show heiken ashi candles concurrently with above main chart regular candles.
Nothing special about it other than displaying bull/bear ha candles with a twist of third color candle (orange default) which is shown when HA candle gets a wick in opposite direction of movement which usually indicates potential directional weakness.
It also provides various moving average line types based upon the HA high, low, close, open values (HLC4) that can used if you are into watching for a cross over of the HA candle to a MA line.
Note: You can also display this over the main chart as an overlay just by selecting the three dots on the indicator and "Move to" option. Be advised doing so will probably cause too much overlapping onto the regular candles.
Heiken Ashi (HA) candles indicate strength usually when the candles have wicks in the direction of the movement, ie. top wicks on green candles w/NO wicks on bottom and vice versa for bearish behavior (bottom wicks on red candles). Weakness in the movement CAN be spotted by watching for wicks opposite the movement appearing.
This indicator can be used in a lower pane to show heiken ashi candles concurrently with above main chart regular candles.
Nothing special about it other than displaying bull/bear ha candles with a twist of third color candle (orange default) which is shown when HA candle gets a wick in opposite direction of movement which usually indicates potential directional weakness.
It also provides various moving average line types based upon the HA high, low, close, open values (HLC4) that can used if you are into watching for a cross over of the HA candle to a MA line.
Note: You can also display this over the main chart as an overlay just by selecting the three dots on the indicator and "Move to" option. Be advised doing so will probably cause too much overlapping onto the regular candles.
リリースノート
Fixed Bugs regarding timeframes and added multi time frame options.オープンソーススクリプト
TradingViewの精神に則り、このスクリプトの作者はコードをオープンソースとして公開してくれました。トレーダーが内容を確認・検証できるようにという配慮です。作者に拍手を送りましょう!無料で利用できますが、コードの再公開はハウスルールに従う必要があります。
免責事項
この情報および投稿は、TradingViewが提供または推奨する金融、投資、トレード、その他のアドバイスや推奨を意図するものではなく、それらを構成するものでもありません。詳細は利用規約をご覧ください。
オープンソーススクリプト
TradingViewの精神に則り、このスクリプトの作者はコードをオープンソースとして公開してくれました。トレーダーが内容を確認・検証できるようにという配慮です。作者に拍手を送りましょう!無料で利用できますが、コードの再公開はハウスルールに従う必要があります。
免責事項
この情報および投稿は、TradingViewが提供または推奨する金融、投資、トレード、その他のアドバイスや推奨を意図するものではなく、それらを構成するものでもありません。詳細は利用規約をご覧ください。