OPEN-SOURCE SCRIPT
High/Low Weekly Timeframe
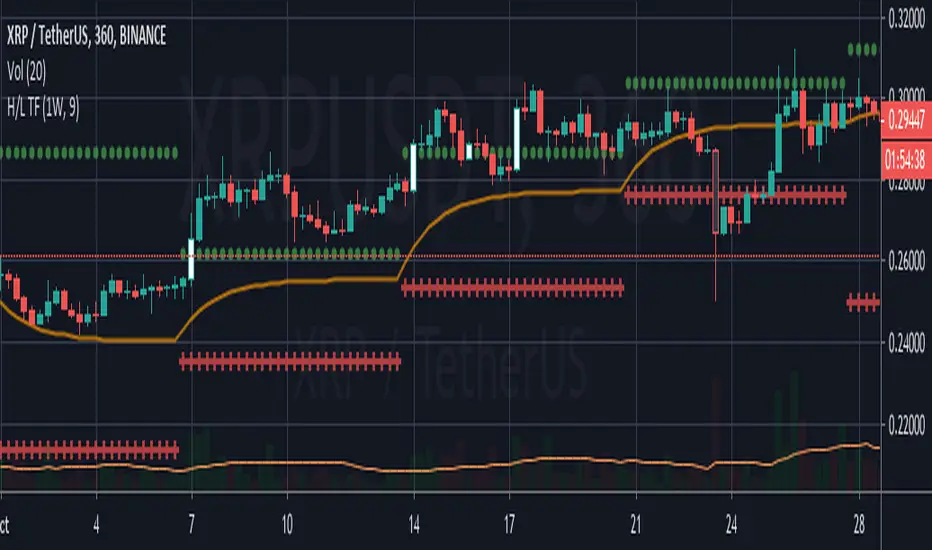
I'm testing a simple but useful indicator that plots the high and low for the current week. The time-frame can be selected by the user.
It's useful when you're trading in a smaller time-frame (example: 1H or 4H) to know exactly the weekly low and high, and whether the price breaks above or below this price lines.
This indicator allows you:
- To select the desired time-frame to get the Low and High.
- To print an optional EMA for the same time-frame.
- To optionally change the bar-color when the close price crosses above the weekly high or crosses below the weekly low.
Hope this helps you to visually identify price movements.
If you like this script please give me a like and comment below.
Thanks,
Rodrigo
オープンソーススクリプト
TradingViewの精神に則り、このスクリプトの作者はコードをオープンソースとして公開してくれました。トレーダーが内容を確認・検証できるようにという配慮です。作者に拍手を送りましょう!無料で利用できますが、コードの再公開はハウスルールに従う必要があります。
免責事項
この情報および投稿は、TradingViewが提供または推奨する金融、投資、トレード、その他のアドバイスや推奨を意図するものではなく、それらを構成するものでもありません。詳細は利用規約をご覧ください。
オープンソーススクリプト
TradingViewの精神に則り、このスクリプトの作者はコードをオープンソースとして公開してくれました。トレーダーが内容を確認・検証できるようにという配慮です。作者に拍手を送りましょう!無料で利用できますが、コードの再公開はハウスルールに従う必要があります。
免責事項
この情報および投稿は、TradingViewが提供または推奨する金融、投資、トレード、その他のアドバイスや推奨を意図するものではなく、それらを構成するものでもありません。詳細は利用規約をご覧ください。