OPEN-SOURCE SCRIPT
更新済 FLEX KDJ IND
Hi Dears!
Here you have this ability to define different methods to aquire high and low bonds in KDJ indicator.
Thses Topologies are available in Popup menu and could be defined by user:
- "AVG" : Use average of cashed data in both High and low Bond
- "MEDIAN" : Use median of cashed data in both High and low Bond
- "MAX" : Use Max of cashed data in both High and low Bond
- "MIN" : Use Min of cashed data in both High and low Bond
- "WIDE" : Use Max of cashed data in High and Min of them for low Bond
- "NARROW" : Use Min of cashed data in High and Max of them for low Bond
- "FIX" : Use predefined constant values by user in 'Max BOND' and 'Min BOND'
- "GAUSS" Use statistical standard deviation method and 'Mult. Max BOND' and 'Mult. Min BOND' to calculate High and low Bond.
In "LEFT RANGE" and "RIGHT RANGE" you can define the range which be used to find pivot and extremum points in calculation of highest and lowest LONG-TERM KDJ Line.
'MEMORY' is the size of cash that you want to collect the extracted data from extreimum points for highest and lowest LONG-TERM-KDJ. If overflowing from this point the oldest value would be kicked from cash.
Other parts are same in KDJ Indicators.
Enjoy trading!
Shakib.
リリースノート
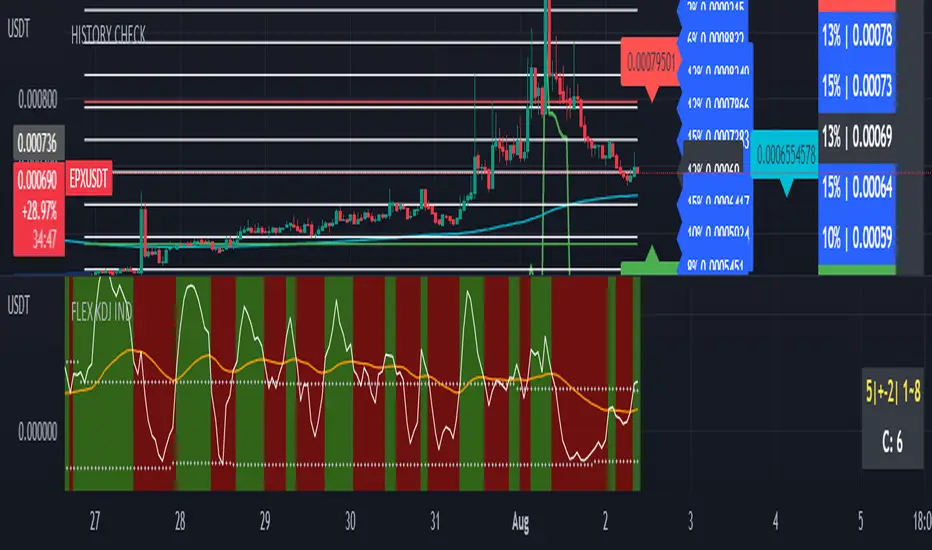
There were two variables that has to be reversed.Add to this now user has a number to guess till when red area would be continued.
Firts number in yellow is the Average, second one is the Std and thirs one is the range.
White value is the current (or the last) counter in red area.
ENJOY!
リリースノート
Two smoothing length are now separated to be similar to what we have in KDJ IND in binance.リリースノート
I just check it and found that the picture of indicator is not relevant to the indicator! The version is still same as before just pictured in published script is changed.happy trade
リリースノート
Hi Dears!in new Version you have two more options for your boundaries definitions:
- [LOWER BOND, UPPER BOND]
オープンソーススクリプト
TradingViewの精神に則り、このスクリプトの作者はコードをオープンソースとして公開してくれました。トレーダーが内容を確認・検証できるようにという配慮です。作者に拍手を送りましょう!無料で利用できますが、コードの再公開はハウスルールに従う必要があります。
免責事項
この情報および投稿は、TradingViewが提供または推奨する金融、投資、トレード、その他のアドバイスや推奨を意図するものではなく、それらを構成するものでもありません。詳細は利用規約をご覧ください。
オープンソーススクリプト
TradingViewの精神に則り、このスクリプトの作者はコードをオープンソースとして公開してくれました。トレーダーが内容を確認・検証できるようにという配慮です。作者に拍手を送りましょう!無料で利用できますが、コードの再公開はハウスルールに従う必要があります。
免責事項
この情報および投稿は、TradingViewが提供または推奨する金融、投資、トレード、その他のアドバイスや推奨を意図するものではなく、それらを構成するものでもありません。詳細は利用規約をご覧ください。