OPEN-SOURCE SCRIPT
Average True Range Percent
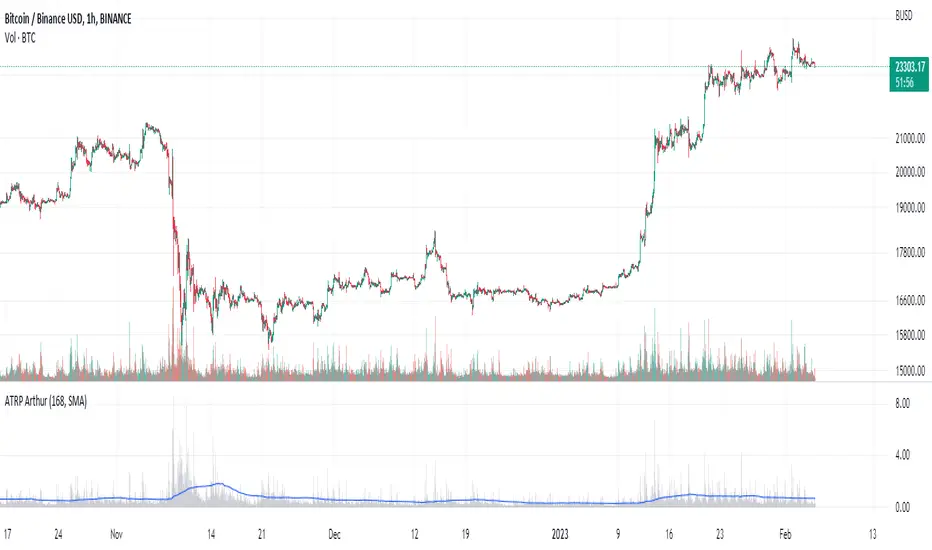
When writing the Quickfingers Luc base scanner (Marvin) script, I wanted a measure of volatility that would be comparable between charts. The traditional Average True Range (ATR) indicator calculates a discrete number providing the average true range of that chart for a specified number of periods. The ATR is not comparable across different price charts.
Average True Range Percent (ATRP) measures the true range for the period, converts it to a percentage using the average of the period's range ((high + low) / 2) and then smooths the percentage. The ATRP provides a measure of volatility that is comparable between charts showing their relative volatility.
Enjoy.
オープンソーススクリプト
TradingViewの精神に則り、このスクリプトの作者はコードをオープンソースとして公開してくれました。トレーダーが内容を確認・検証できるようにという配慮です。作者に拍手を送りましょう!無料で利用できますが、コードの再公開はハウスルールに従う必要があります。
免責事項
この情報および投稿は、TradingViewが提供または推奨する金融、投資、トレード、その他のアドバイスや推奨を意図するものではなく、それらを構成するものでもありません。詳細は利用規約をご覧ください。
オープンソーススクリプト
TradingViewの精神に則り、このスクリプトの作者はコードをオープンソースとして公開してくれました。トレーダーが内容を確認・検証できるようにという配慮です。作者に拍手を送りましょう!無料で利用できますが、コードの再公開はハウスルールに従う必要があります。
免責事項
この情報および投稿は、TradingViewが提供または推奨する金融、投資、トレード、その他のアドバイスや推奨を意図するものではなく、それらを構成するものでもありません。詳細は利用規約をご覧ください。