OPEN-SOURCE SCRIPT
更新済 Max/Min Levels
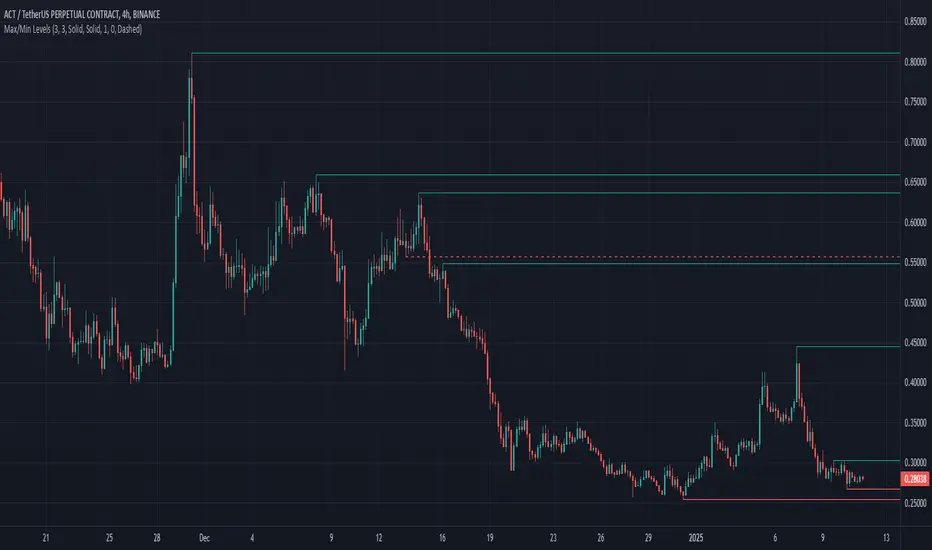
Highlights highs and lows that match the search criteria. A high is considered to be broken if the candlestick breaks through its shadow
A three-candlestick pattern will match the parameters:
A five-candlestick pattern will match the parameters:
A three-candlestick pattern will match the parameters:
- Candle before - 1
- Candle after - 1
A five-candlestick pattern will match the parameters:
- Candle before - 2
- Candle after - 2
リリースノート
Highlights highs and lows that match the search criteria. A high is considered to be broken if the candlestick breaks through its shadowA three-candlestick pattern will match the parameters:
- Candle before - 1
- Candle after - 1
A five-candlestick pattern will match the parameters:
- Candle before - 2
- Candle after - 2
リリースノート
Fixed the issue of false lines appearing at the beginning of the chartリリースノート
Added the option to delete the line immediately after it is crossed or after the candle formation is completeリリースノート
In history, the line continues until it touches a candlestick.Also, the number of lines that can be displayed on the chart has been increased to 150.
リリースノート
Shows the highs and lows that were broken by a single candleリリースノート
Added the ability to set the number of lines to be displayed on the chartリリースノート
Added the ability to enable level breakdown notificationsFirst, mark which notifications you want to receive, about a level breakout or a breakout of resistance and support levels (dashed line on the chart).
Create a new alert and in the "Condition" column select the indicator name. In the column below select "Any alert() function call" if it is not selected and click the "Create" button. That's it, you're done
リリースノート
Added the ability to use the indicator in Pine Screener. Allows you to conveniently search for coins that have a broken level or a pricked level, and also how many percent to the nearest level- New Tab -> Screeners -> Pine (Beta)
https://i.postimg.cc/T1WqyWv4/Max-Min-Screener-1.jpg
- A list with coin pairs
- A timeframe for analysis
- Indicator settings
- Setup the indicator according to your requirements
- Check the box next to "Candle number" to make the indicator work in "Pine Screener" mode
- 0 - analysis of the current candle, 1 - analysis of the second candle on the chart, 2,3... etc.
- Confirm settings
- Click "Scan"
After that, you will see a window with the data
https://i.postimg.cc/wMcJYCCc/Max-Min-Screener-2.jpg
- To Up, To Down, To Broken Up, To Broken Down - Shows how many percent to the nearest level. If the value is negative, it means that the price broke the level
- Pricked Up, Pricked Down, Pricked Broken Up, Pricked Broken Down - "1" means that the price pierced the level with its shadow
Good luck with your search everyone!
オープンソーススクリプト
TradingViewの精神に則り、このスクリプトの作者はコードをオープンソースとして公開してくれました。トレーダーが内容を確認・検証できるようにという配慮です。作者に拍手を送りましょう!無料で利用できますが、コードの再公開はハウスルールに従う必要があります。
免責事項
この情報および投稿は、TradingViewが提供または推奨する金融、投資、トレード、その他のアドバイスや推奨を意図するものではなく、それらを構成するものでもありません。詳細は利用規約をご覧ください。
オープンソーススクリプト
TradingViewの精神に則り、このスクリプトの作者はコードをオープンソースとして公開してくれました。トレーダーが内容を確認・検証できるようにという配慮です。作者に拍手を送りましょう!無料で利用できますが、コードの再公開はハウスルールに従う必要があります。
免責事項
この情報および投稿は、TradingViewが提供または推奨する金融、投資、トレード、その他のアドバイスや推奨を意図するものではなく、それらを構成するものでもありません。詳細は利用規約をご覧ください。