OPEN-SOURCE SCRIPT
Rolling VWAP with Bands (Locked Timeframe)
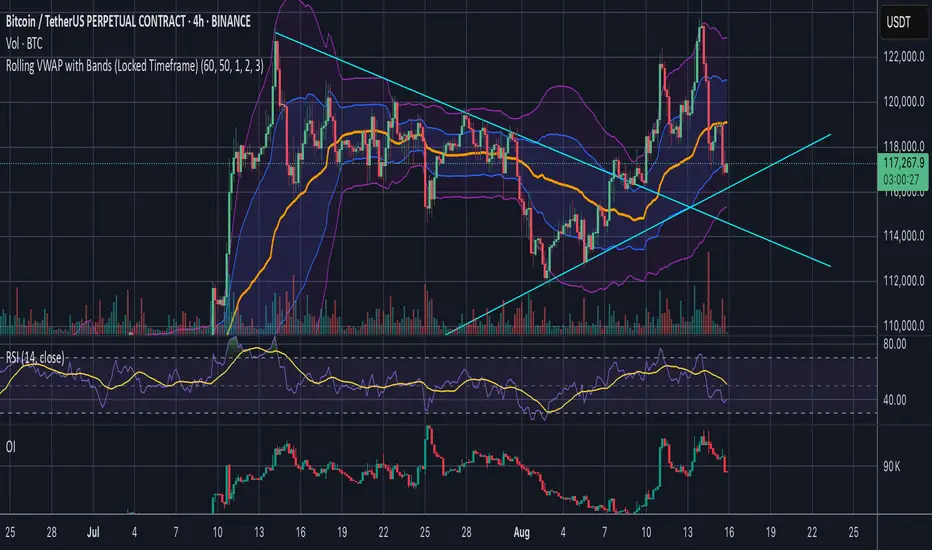
Rolling VWAP with Customizable Bands — Locked Timeframe
This indicator plots a rolling Volume Weighted Average Price (VWAP) over a fixed, user-selected timeframe — so it stays consistent no matter what chart timeframe you’re viewing. Unlike the standard anchored VWAP, this one works like a moving average weighted by volume, providing a smoother, more adaptive central price line that doesn’t reset each session.
It also includes up to three optional deviation bands, each with its own toggle and multiplier setting. The bands are based on standard deviation, helping you quickly identify when price is stretched above or below its mean.
Features:
Locked-timeframe VWAP — calculation stays fixed to your chosen resolution (e.g., 1H, 4H, Daily)
Adjustable lookback length for VWAP calculation
Up to 3 standard deviation bands, each with:
On/Off toggle
Independent multiplier control
Works on any chart timeframe without changing shape
Optional filled shading between bands for clarity
Uses:
Spot overbought/oversold conditions relative to VWAP
Identify dynamic support & resistance
Confirm trend strength or mean reversion setups
Keep a consistent reference line across multiple chart timeframes
オープンソーススクリプト
TradingViewの精神に則り、このスクリプトの作者はコードをオープンソースとして公開してくれました。トレーダーが内容を確認・検証できるようにという配慮です。作者に拍手を送りましょう!無料で利用できますが、コードの再公開はハウスルールに従う必要があります。
免責事項
この情報および投稿は、TradingViewが提供または推奨する金融、投資、トレード、その他のアドバイスや推奨を意図するものではなく、それらを構成するものでもありません。詳細は利用規約をご覧ください。
オープンソーススクリプト
TradingViewの精神に則り、このスクリプトの作者はコードをオープンソースとして公開してくれました。トレーダーが内容を確認・検証できるようにという配慮です。作者に拍手を送りましょう!無料で利用できますが、コードの再公開はハウスルールに従う必要があります。
免責事項
この情報および投稿は、TradingViewが提供または推奨する金融、投資、トレード、その他のアドバイスや推奨を意図するものではなく、それらを構成するものでもありません。詳細は利用規約をご覧ください。