OPEN-SOURCE SCRIPT
更新済 KINSKI Flexible MACD
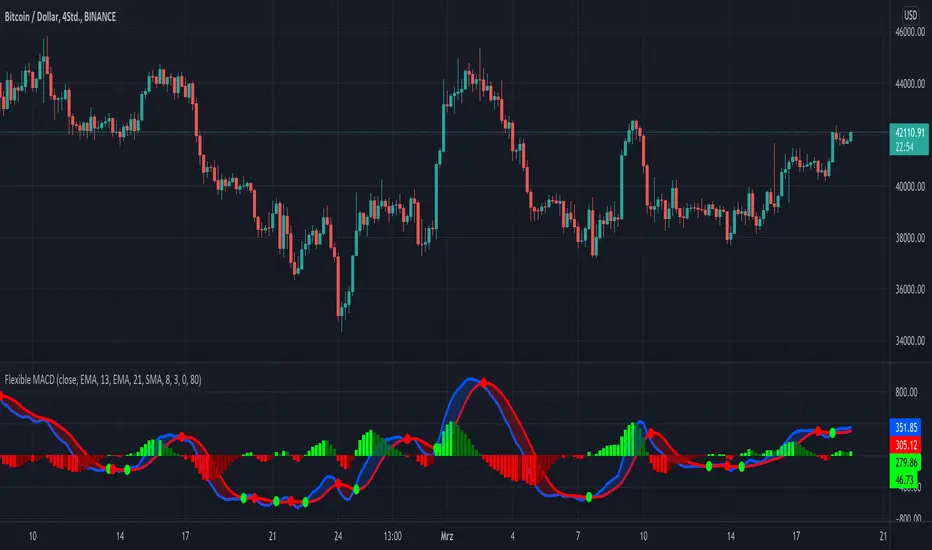
Flexible MACD (Moving Average Convergence/Divergence) Indicator
The Moving Average Convergence Divergence consists of three elements: two moving averages (the MACD line and the signal line) and a histogram. The blue MACD line is the difference between a longer and a shorter EMA (here 13 and 21 periods preset), the red signal line is an SMA (here 8 preset) on the MACD line. The histogram (green: ascending, red: descending) shows the difference between both lines.
As soon as the blue MACD line crosses the red signal line, circles are generated that indicate an up/down trend. If the red signal line is greater than or equal to the blue MACD line, this indicates a downward trend (red circle). If the blue MACD line is greater than or equal to the red signal line, this indicates an upward trend (green circle).
The special thing about this MACD indicator is the many setting options, especially the definition of the MA variants for MACD (Fast, Slow) and signal. You can define the following MA types: "COVWMA", "DEMA", "EMA", "EHMA", "FRAMA", "HMA", "KAMA", "RMA", "SMA", "SMMA", "VIDYA", "VWMA", "WMA".
You also have the following display options:
- "Up/Down Movements: On/Off" - Shows ascending and descending MACD, signal lines
- "Up/Down Movements: Rising Length" - Defines the length from which ascending or descending lines are detected
- "Bands: On/Off" - Fills the space between MACD and signal lines with colors to indicate up or down trends
- "Bands: Transparency" - sets the transparency of the fill color
Disclaimer: I am not a financial advisor. For purpose educate only. Use at your own risk.
リリースノート
- PineScript 4 compatibility increased. Deprecated attribute "transp" replaced by function color.new()
- Update function "funcSMMA()": extract the call of the the function 'sma' from the ternary operator
リリースノート
- Convert to PineScript5
リリースノート
- using PineScript "Groups" to sort the Options for better usability
- Updating the code while retaining the previous functionality
リリースノート
- add new MA Type "TEMA" (Triple EMA)
オープンソーススクリプト
TradingViewの精神に則り、このスクリプトの作者はコードをオープンソースとして公開してくれました。トレーダーが内容を確認・検証できるようにという配慮です。作者に拍手を送りましょう!無料で利用できますが、コードの再公開はハウスルールに従う必要があります。
My published Scripts:
de.tradingview.com/u/KINSKI/
Appreciation of my work: paypal.com/paypalme/steffenhollstein
de.tradingview.com/u/KINSKI/
Appreciation of my work: paypal.com/paypalme/steffenhollstein
免責事項
この情報および投稿は、TradingViewが提供または推奨する金融、投資、トレード、その他のアドバイスや推奨を意図するものではなく、それらを構成するものでもありません。詳細は利用規約をご覧ください。