INVITE-ONLY SCRIPT
更新済 STOH‴ | Stocastic Histogram
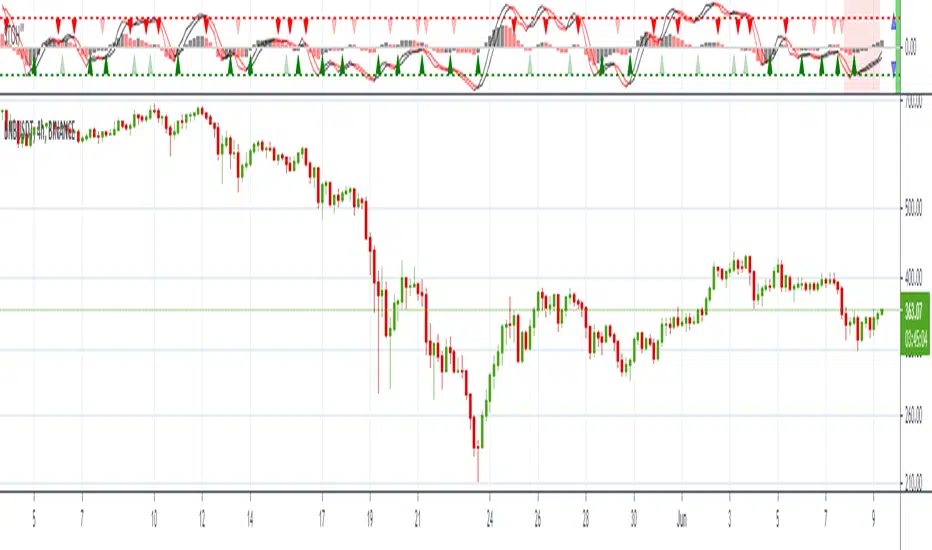
STOH‴ our Stochastic Histogram is a Stochastic oscillator as the original one but this one that allows you to have a better understanding and interpretation of its behavior once you are able to:
1. see colored lines when it changes its direction;
2. see colored arrow upward/downward when the %K line crossover/crossunder the %D line;
3. see colored histogram, and additional sign as of in the MACDH indicator;
4. see the indicator with Ordinary or Directional Momentum OHLC values;
5. far right side of the indicator shows bars to that provides the buy/sell signal status:
- the right side bar shows if the indicator is on an upward (green color) or downward (red color) full trend for both lines and histogram;
- the left side bar shows if the indicator's trend is being threatened (yellow color).
- a par of arrows provide the trader the sense of histogram current bar Expansion bias (point top-up and bottom-down) or Contraction bias (point top-down and bottom-up)
p.s.: notice that this version of the indicator has different overbought/oversold zone levels due to the histogram that fluctuates the zero line.
Believe me, this indicator will make your life much easier!
To have access to this indicator, please contact DM me.
リリースノート
Some new features:1. ability to set the timeframe the indicator will present eventhough in a different timeframe window;
2. light red background presented every time the Volatility is activated in the indicator's timeframe.
招待専用スクリプト
このスクリプトは作者が承認したユーザーのみアクセス可能です。使用するにはアクセス申請をして許可を得る必要があります。通常は支払い後に承認されます。詳細は下記の作者の指示に従うか、MarceloTorresに直接お問い合わせください。
TradingViewは、作者を完全に信頼し、スクリプトの動作を理解していない限り、有料スクリプトの購入・使用を推奨しません。コミュニティスクリプトには無料のオープンソースの代替が多数あります。
作者の指示
If you are interested in this indicator, please DM me.
Don't contact me in the comment area.
TRADEWISER | Marcelo Torres
marcelo@tradewiser.pro
Vídeo-Análise completa diária no YouTube:
youtube.com/c/TradeWiserPro
Curso/AE
CursoAE.TradeWiser.pro
@TradeWiserPro
Telegram, Twitter, Facebook, LinkedIn, Instagram
marcelo@tradewiser.pro
Vídeo-Análise completa diária no YouTube:
youtube.com/c/TradeWiserPro
Curso/AE
CursoAE.TradeWiser.pro
@TradeWiserPro
Telegram, Twitter, Facebook, LinkedIn, Instagram
免責事項
この情報および投稿は、TradingViewが提供または推奨する金融、投資、トレード、その他のアドバイスや推奨を意図するものではなく、それらを構成するものでもありません。詳細は利用規約をご覧ください。