OPEN-SOURCE SCRIPT
USDT.D + USDT.C ALL TIMEFRAMES
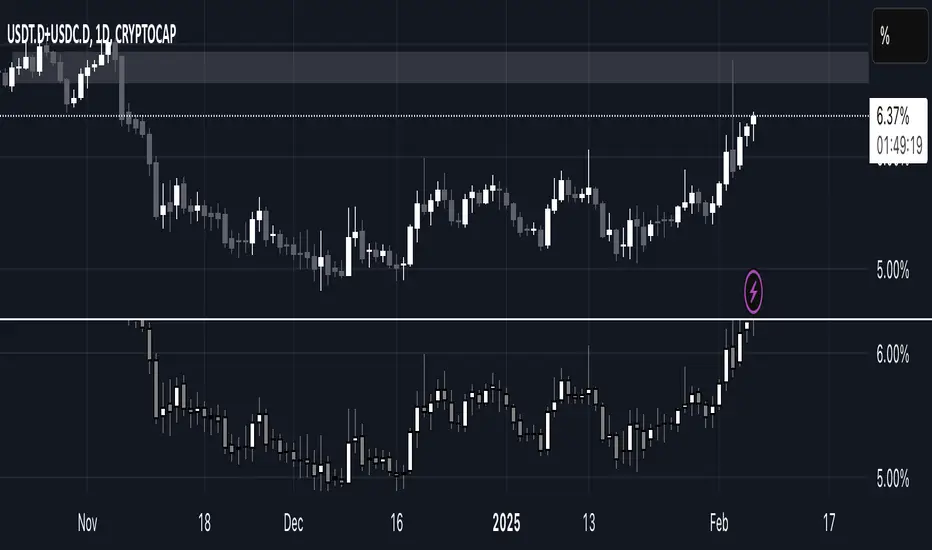
This indicator combines the dominance of USDT (USDT.D) and USDC (USDC.D) to track total stablecoin market share across all timeframes. It displays the combined dominance as candlesticks, providing a clearer view of market liquidity shifts and investor sentiment.
📌 How to Use:
Green candles indicate rising stablecoin dominance (potential risk-off sentiment).
Red candles indicate declining stablecoin dominance (potential risk-on sentiment).
Works on all timeframes, from intraday scalping to macro trend analysis.
This tool is essential for traders looking to analyze stablecoin liquidity flow, identify market turning points, and refine trading strategies based on stablecoin dominance behavior. 🚀
オープンソーススクリプト
TradingViewの精神に則り、このスクリプトの作者はコードをオープンソースとして公開してくれました。トレーダーが内容を確認・検証できるようにという配慮です。作者に拍手を送りましょう!無料で利用できますが、コードの再公開はハウスルールに従う必要があります。
免責事項
この情報および投稿は、TradingViewが提供または推奨する金融、投資、トレード、その他のアドバイスや推奨を意図するものではなく、それらを構成するものでもありません。詳細は利用規約をご覧ください。
オープンソーススクリプト
TradingViewの精神に則り、このスクリプトの作者はコードをオープンソースとして公開してくれました。トレーダーが内容を確認・検証できるようにという配慮です。作者に拍手を送りましょう!無料で利用できますが、コードの再公開はハウスルールに従う必要があります。
免責事項
この情報および投稿は、TradingViewが提供または推奨する金融、投資、トレード、その他のアドバイスや推奨を意図するものではなく、それらを構成するものでもありません。詳細は利用規約をご覧ください。