OPEN-SOURCE SCRIPT
更新済 liquidity volume

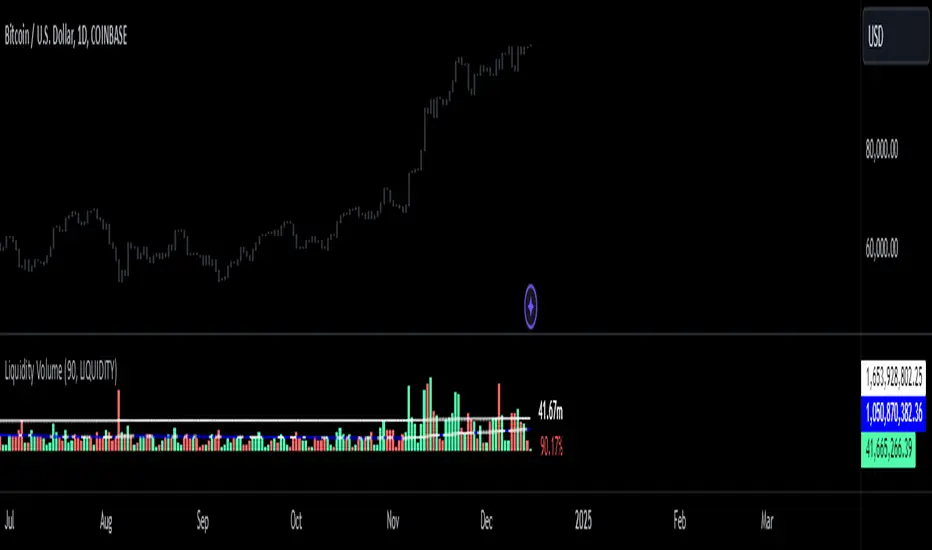
just like volume, this indicator shows how much in dollars were traded in millions.
リリースノート
made the volume bars represent colors based on bearish or bullish movementリリースノート
added a mean (average) to the script. リリースノート
added a 3rd standard deviation to the indicator. a 3sd occurrence has a 0.2% chance of occurrence on a statistical standpoint. but when it comes to markets it happens more often. nonetheless, a 3sd alert can signify a major market movement due to increase of activity of dollars going in or out of that asset you are observing. P.S.A. go on settings, under style tab, change the "price line" to a histogram. リリースノート
changed the plotted liqudity to a column リリースノート
when the line is purple that means that liquidity is going down. when the line is white that means liquidity is going up リリースノート
ive made improvements on the script. easier to use and readリリースノート
made a little bit more modificationリリースノート
you can switch from representation of liquidity and equity. equity is just normal volumeリリースノート
we have added a new stat. you can see how much volume has increased/decreased from the previous bar in percentageリリースノート
modified the separation of labels so no overlapping occursリリースノート
オープンソーススクリプト
TradingViewの精神に則り、このスクリプトの作者はコードをオープンソースとして公開してくれました。トレーダーが内容を確認・検証できるようにという配慮です。作者に拍手を送りましょう!無料で利用できますが、コードの再公開はハウスルールに従う必要があります。
免責事項
この情報および投稿は、TradingViewが提供または推奨する金融、投資、トレード、その他のアドバイスや推奨を意図するものではなく、それらを構成するものでもありません。詳細は利用規約をご覧ください。
オープンソーススクリプト
TradingViewの精神に則り、このスクリプトの作者はコードをオープンソースとして公開してくれました。トレーダーが内容を確認・検証できるようにという配慮です。作者に拍手を送りましょう!無料で利用できますが、コードの再公開はハウスルールに従う必要があります。
免責事項
この情報および投稿は、TradingViewが提供または推奨する金融、投資、トレード、その他のアドバイスや推奨を意図するものではなく、それらを構成するものでもありません。詳細は利用規約をご覧ください。