OPEN-SOURCE SCRIPT
Quasimodo Pattern
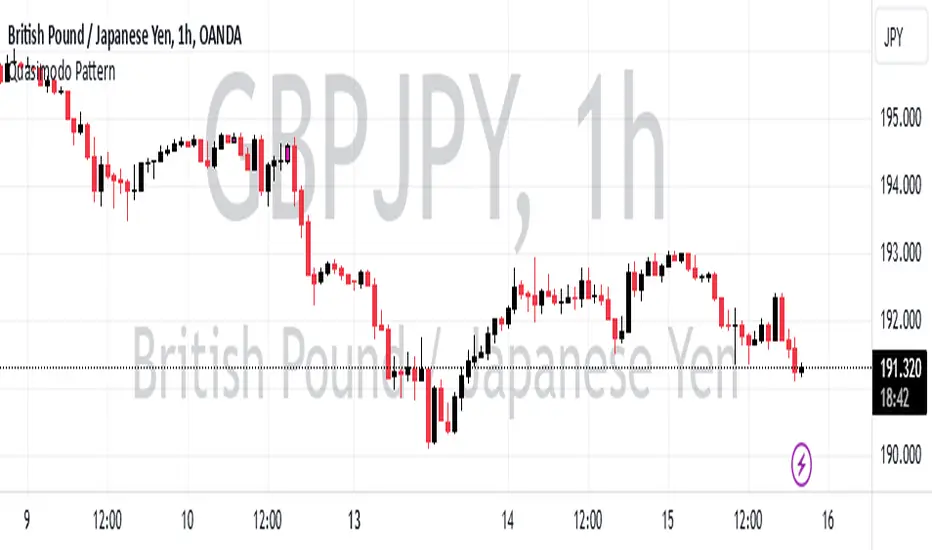
What is a Quasimodo Pattern?
A Quasimodo Pattern is a chart pattern traders look for to predict possible price reversals in the market:
- Bullish Quasimodo: Signals a possible price increase (buying opportunity).
- Bearish Quasimodo: Signals a potential price decrease (selling opportunity).
How the Script Works
1. Bullish Quasimodo:
- Checks if the price pattern shows signs of a potential upward movement:
- The current low price is higher than a previous price point (suggesting fair value gap).
- The previous candle closed higher than it opened (bullish candle).
- The candle before that closed lower than it opened (bearish candle).
2. Bearish Quasimodo:
- Looks for signs of a downward movement:
- The current high price is lower than a previous price point (suggesting fair value gap).
- The previous candle closed lower than it opened (bearish candle).
- The candle before that closed higher than it opened (bullish candle).
Visual Indicators
- Yellow Candles: Indicate a bullish Quasimodo pattern.
- Pink Candles: Indicate a bearish Quasimodo pattern.
Alerts
If a Quasimodo pattern is detected, the script sends an alert:
- The alert says: "A Quasimodo Pattern has appeared!"
Purpose
Traders can use this tool to quickly spot potential trend changes without manually analyzing every chart, saving time and improving decision-making for trades.
オープンソーススクリプト
TradingViewの精神に則り、このスクリプトの作者はコードをオープンソースとして公開してくれました。トレーダーが内容を確認・検証できるようにという配慮です。作者に拍手を送りましょう!無料で利用できますが、コードの再公開はハウスルールに従う必要があります。
免責事項
この情報および投稿は、TradingViewが提供または推奨する金融、投資、トレード、その他のアドバイスや推奨を意図するものではなく、それらを構成するものでもありません。詳細は利用規約をご覧ください。
オープンソーススクリプト
TradingViewの精神に則り、このスクリプトの作者はコードをオープンソースとして公開してくれました。トレーダーが内容を確認・検証できるようにという配慮です。作者に拍手を送りましょう!無料で利用できますが、コードの再公開はハウスルールに従う必要があります。
免責事項
この情報および投稿は、TradingViewが提供または推奨する金融、投資、トレード、その他のアドバイスや推奨を意図するものではなく、それらを構成するものでもありません。詳細は利用規約をご覧ください。