OPEN-SOURCE SCRIPT
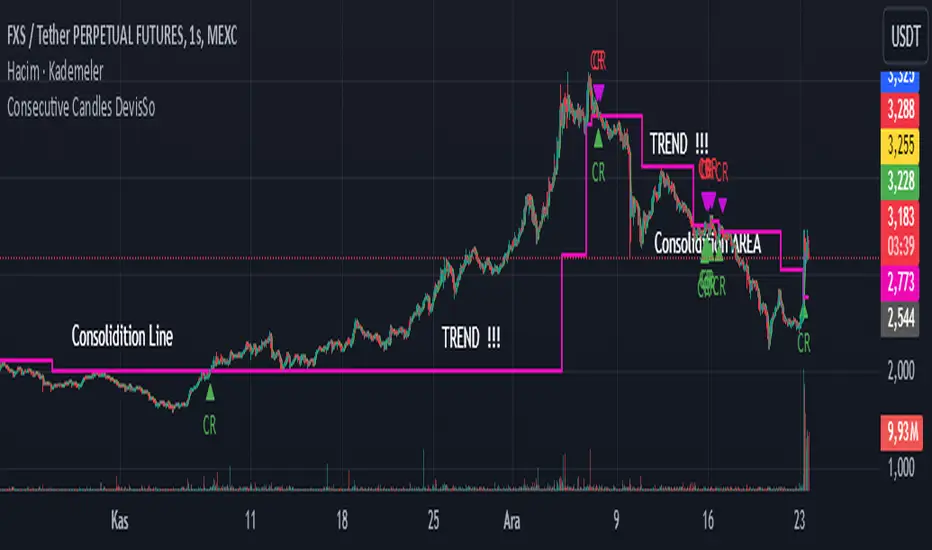
Consecutive Candles DevisSo

Hi Traders !!!
Level Calculation:
50% and 23.6% Fibonacci levels are calculated based on the open and close of the previous candles.
Consecutive Candle Check:
For an uptrend: Each candle's low must not touch the 50% levels of the previous candles.
For a downtrend: Each candle's high must not touch the 50% levels of the previous candles.
Pullback Level:
When a long signal is triggered, the current candle's low is recorded as a pullback level.
When a short signal is triggered, the current candle's high is recorded as a pullback level.
Breakout and Signal Generation:
If the price breaks above the calculated level, a long signal is generated; if it breaks below, a short signal is generated.
These signals are visualized on the chart.
Continuity:
The system checks the last signal to ensure the validity of new signals, maintaining the consistency of consecutive signals.
オープンソーススクリプト
TradingViewの精神に則り、このスクリプトの作者はコードをオープンソースとして公開してくれました。トレーダーが内容を確認・検証できるようにという配慮です。作者に拍手を送りましょう!無料で利用できますが、コードの再公開はハウスルールに従う必要があります。
免責事項
この情報および投稿は、TradingViewが提供または推奨する金融、投資、トレード、その他のアドバイスや推奨を意図するものではなく、それらを構成するものでもありません。詳細は利用規約をご覧ください。
オープンソーススクリプト
TradingViewの精神に則り、このスクリプトの作者はコードをオープンソースとして公開してくれました。トレーダーが内容を確認・検証できるようにという配慮です。作者に拍手を送りましょう!無料で利用できますが、コードの再公開はハウスルールに従う必要があります。
免責事項
この情報および投稿は、TradingViewが提供または推奨する金融、投資、トレード、その他のアドバイスや推奨を意図するものではなく、それらを構成するものでもありません。詳細は利用規約をご覧ください。