OPEN-SOURCE SCRIPT
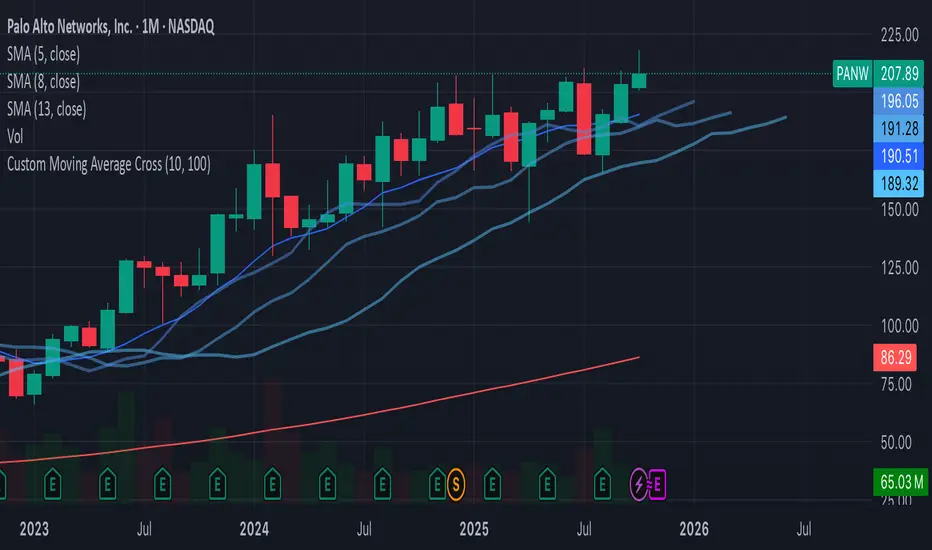
Custom Moving Average Cross - White
//version=5
indicator("Custom Moving Average Cross", overlay=true)
// User-defined parameters for moving averages
short_period = input.int(10, title="Short Period", minval=1)
long_period = input.int(100, title="Long Period", minval=1)
// Calculate the moving averages
short_ma = ta.sma(close, short_period)
long_ma = ta.sma(close, long_period)
// Plot the moving averages
plot(short_ma, color=color.blue, title="Short MA")
plot(long_ma, color=color.red, title="Long MA")
// Define the buy and sell conditions based on crossovers
buy_signal = ta.crossover(short_ma, long_ma)
sell_signal = ta.crossunder(short_ma, long_ma)
// Plot the buy and sell signals with labels (white text)
plotshape(buy_signal, location=location.belowbar, color=color.green, style=shape.labelup, title="Buy Signal", text="BUY", textcolor=color.white)
plotshape(sell_signal, location=location.abovebar, color=color.red, style=shape.labeldown, title="Sell Signal", text="SELL", textcolor=color.white)
// Optional: Background color to highlight the signals
bgcolor(buy_signal ? color.new(color.green, 90) : na, title="Buy Signal Background")
bgcolor(sell_signal ? color.new(color.red, 90) : na, title="Sell Signal Background")
オープンソーススクリプト
TradingViewの精神に則り、この作者はスクリプトのソースコードを公開しているので、その内容を理解し検証することができます。作者に感謝です!無料でお使いいただけますが、このコードを投稿に再利用する際にはハウスルールに従うものとします。
免責事項
これらの情報および投稿は、TradingViewが提供または保証する金融、投資、取引、またはその他の種類のアドバイスや推奨を意図したものではなく、またそのようなものでもありません。詳しくは利用規約をご覧ください。
オープンソーススクリプト
TradingViewの精神に則り、この作者はスクリプトのソースコードを公開しているので、その内容を理解し検証することができます。作者に感謝です!無料でお使いいただけますが、このコードを投稿に再利用する際にはハウスルールに従うものとします。
免責事項
これらの情報および投稿は、TradingViewが提供または保証する金融、投資、取引、またはその他の種類のアドバイスや推奨を意図したものではなく、またそのようなものでもありません。詳しくは利用規約をご覧ください。