OPEN-SOURCE SCRIPT
更新済 MACD Divergence Fast by RSU
Advantages:
1. When MACD-diff line(orange color) is at a high point, once it falls by 1 k line, it will detect the divergence from the previous high point. This can quickly find the divergence that has taken effect and help you quickly capture the trend before a sharp decline or rise.
2. This indicator detects the previous high and the previous low of 5, 10, 20, 40, 60 lengths at the same time, instead of only detecting a fixed length, so that more divergences can be found.
Notice:
Because it is a quick divergence detection, it is recommended to confirm that the divergence takes effect after the current k is completely closed first. I have identified this state in the indicator as "k not end".
Disadvantages and Risks:
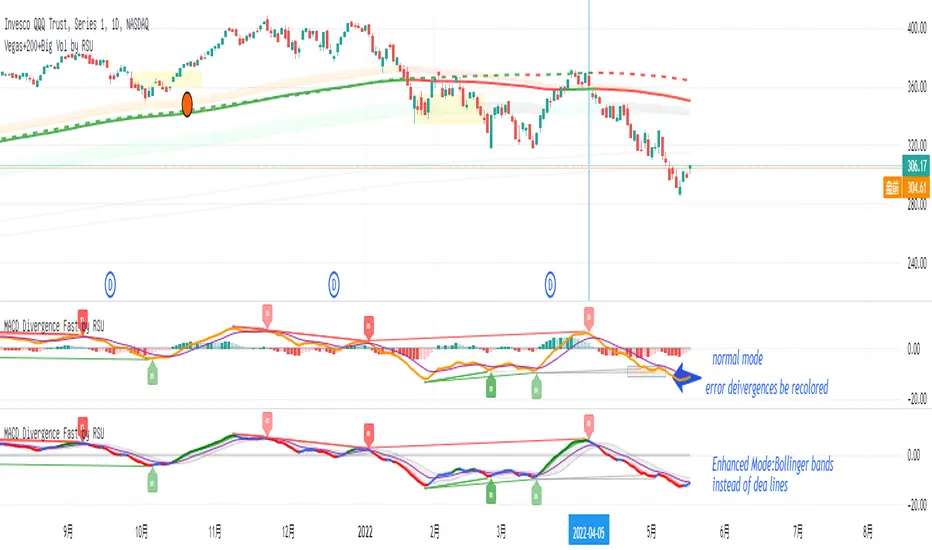
Since it is a quick discovery, there will be error identification. Error divergences will recolor to grey.
Suggestion:
Use “RSI Divergence Fast by RSU” at the same time, because RSI divergence usually occurs before macd, if the position diverges at the same time, the probability of success will increase.
Please do not:
Don't go short in the uptrend, don't go long in the downtrend.
Top divergences that occur because of a strong uptrend are usually only temporary pullbacks. Bottom divergences in persistent declines are also temporary rallies. Do not attempt to trade such low-return trades.
It is recommended to use the divergence indicator when the stock price has made a new high and retraced, and once again made a new high, because this often leads to the end of the trend.
Divergence how to use:
1. After the previous K line was completely closed, a bottom divergence was found.
2. Open an long order at the beginning of the second bar, or as close to the bottom as possible (because the stop loss will be smaller).
3. Break the stop loss price below the previous low where the divergence occurred, which already means that the divergence is wrong.
1. When MACD-diff line(orange color) is at a high point, once it falls by 1 k line, it will detect the divergence from the previous high point. This can quickly find the divergence that has taken effect and help you quickly capture the trend before a sharp decline or rise.
2. This indicator detects the previous high and the previous low of 5, 10, 20, 40, 60 lengths at the same time, instead of only detecting a fixed length, so that more divergences can be found.
Notice:
Because it is a quick divergence detection, it is recommended to confirm that the divergence takes effect after the current k is completely closed first. I have identified this state in the indicator as "k not end".
Disadvantages and Risks:
Since it is a quick discovery, there will be error identification. Error divergences will recolor to grey.
Suggestion:
Use “RSI Divergence Fast by RSU” at the same time, because RSI divergence usually occurs before macd, if the position diverges at the same time, the probability of success will increase.
Please do not:
Don't go short in the uptrend, don't go long in the downtrend.
Top divergences that occur because of a strong uptrend are usually only temporary pullbacks. Bottom divergences in persistent declines are also temporary rallies. Do not attempt to trade such low-return trades.
It is recommended to use the divergence indicator when the stock price has made a new high and retraced, and once again made a new high, because this often leads to the end of the trend.
Divergence how to use:
1. After the previous K line was completely closed, a bottom divergence was found.
2. Open an long order at the beginning of the second bar, or as close to the bottom as possible (because the stop loss will be smaller).
3. Break the stop loss price below the previous low where the divergence occurred, which already means that the divergence is wrong.
リリースノート
change:Join enhanced mode, Using Bollinger bands instead of dea line,Also hide the macd histogram.This makes it possible to catch cross faster than using the dea line in normal mode.
リリースノート
change:Fixed a bug that recolor error divergences.リリースノート
1オープンソーススクリプト
TradingViewの精神に則り、このスクリプトの作者はコードをオープンソースとして公開してくれました。トレーダーが内容を確認・検証できるようにという配慮です。作者に拍手を送りましょう!無料で利用できますが、コードの再公開はハウスルールに従う必要があります。
免責事項
この情報および投稿は、TradingViewが提供または推奨する金融、投資、トレード、その他のアドバイスや推奨を意図するものではなく、それらを構成するものでもありません。詳細は利用規約をご覧ください。
オープンソーススクリプト
TradingViewの精神に則り、このスクリプトの作者はコードをオープンソースとして公開してくれました。トレーダーが内容を確認・検証できるようにという配慮です。作者に拍手を送りましょう!無料で利用できますが、コードの再公開はハウスルールに従う必要があります。
免責事項
この情報および投稿は、TradingViewが提供または推奨する金融、投資、トレード、その他のアドバイスや推奨を意図するものではなく、それらを構成するものでもありません。詳細は利用規約をご覧ください。