OPEN-SOURCE SCRIPT
更新済 Comparative Relative Strength of a stock
Perform comparative relative strength of a stock. Default base is NIFTY 50.
リリースノート
Cosmetic changes to make the display pretty and input choices in more logical sequence.リリースノート
Added input as source. Some cosmetic changes.リリースノート
- version 5
- Added color code for CRS moving average
A color-based trend on the Ratio moving average. The trend lookback is configurable.
リリースノート
- Possible to plot candles, of ratio chart, instead of line chart only.
リリースノート
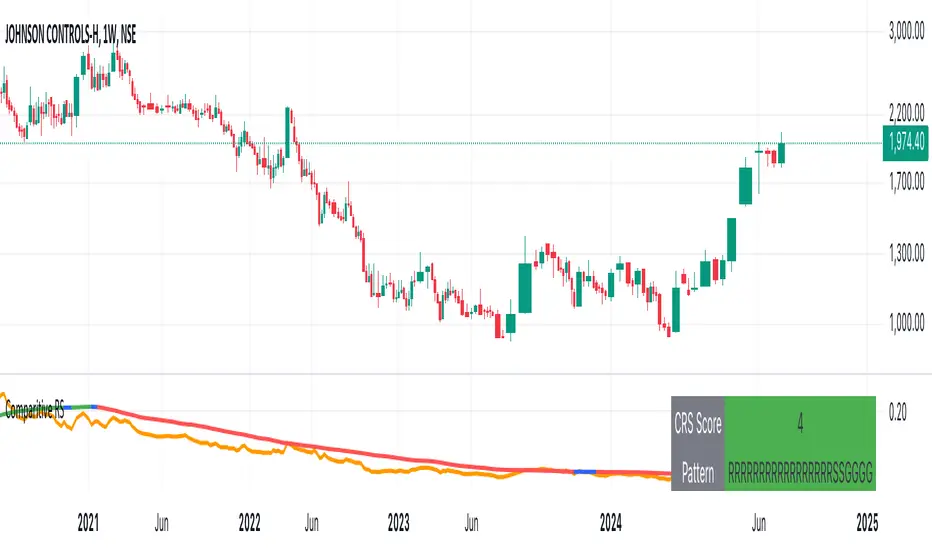
Updated to include a "CRS Score" and "CRS Pattern"- CRS Score: The number of consecutive bars, when the trend of the relative strength is increasing/decreasing. If CRS is falling, score will be negative, if rising, score will be positive and 0 if it is neither positive nor negative (blue)
- CRS Pattern: The pattern of the last 23 (default) bars for the CRS Trend.
If say, the CRS Pattern is RRRRRRRRRSSGG - It means that after 11 bars, the strength is now positive for last 2 bars. This is a good way to visualise a turn around in relative strength of the stock. Higher the number of opposite trend the greater that chance of the reversal.
オープンソーススクリプト
TradingViewの精神に則り、このスクリプトの作者はコードをオープンソースとして公開してくれました。トレーダーが内容を確認・検証できるようにという配慮です。作者に拍手を送りましょう!無料で利用できますが、コードの再公開はハウスルールに従う必要があります。
免責事項
この情報および投稿は、TradingViewが提供または推奨する金融、投資、トレード、その他のアドバイスや推奨を意図するものではなく、それらを構成するものでもありません。詳細は利用規約をご覧ください。
オープンソーススクリプト
TradingViewの精神に則り、このスクリプトの作者はコードをオープンソースとして公開してくれました。トレーダーが内容を確認・検証できるようにという配慮です。作者に拍手を送りましょう!無料で利用できますが、コードの再公開はハウスルールに従う必要があります。
免責事項
この情報および投稿は、TradingViewが提供または推奨する金融、投資、トレード、その他のアドバイスや推奨を意図するものではなく、それらを構成するものでもありません。詳細は利用規約をご覧ください。