INVITE-ONLY SCRIPT
Takashi Divergence (RSI) | 2nd Gen | [Alerts]
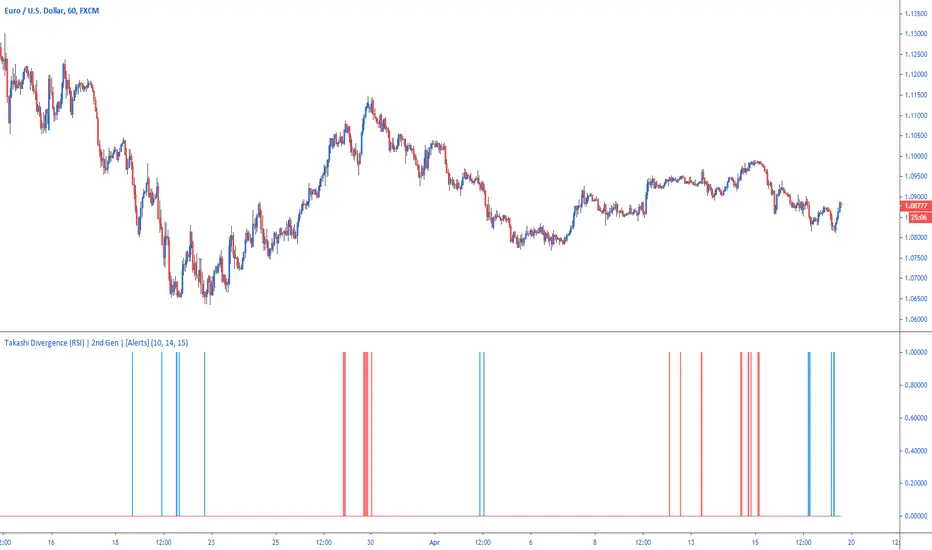
Easily highlight positive or negative divergence between price movement and RSI with Takashi-powered Divergence analysis.
Divergence strategy signals a potential reversal point because directional momentum does not confirm price. A bullish divergence occurs when the underlying market makes a lower low and RSI forms a higher low: RSI does not confirm the lower low and this shows strengthening momentum. A bearish divergence forms when the market records a higher high and RSI forms a lower high: RSI does not confirm the new high and this shows weakening momentum.
Inputs
Divergence Sensitivity
Float input. Sets a threshold after when the RSI divergence is triggered.
RSI Length
Integer input. The default setting used by most traders for the RSI is 14. That means that the indicator will go back 14 periods or time frames based on the chart being used (14 days on a Daily chart , 14 hours on an hourly chart and so forth) and make its calculation based on that.
Cross Distance
Integer input. Value from RSI that above or below 50 that classifies bullish or bearish levels. By default 15, that means the script will be checking for positive divergence when RSI is below 35 (50-15) and negative divergence when RSI is above 75 (50+15).
Use High & Low
Bool input. If true uses high and low values as RSI source.
To get access to this and other scripts check links below.
招待専用スクリプト
このスクリプトは作者が承認したユーザーのみアクセス可能です。使用するにはアクセス申請をして許可を得る必要があります。通常は支払い後に承認されます。詳細は下記の作者の指示に従うか、kaiompに直接お問い合わせください。
TradingViewは、作者を完全に信頼し、スクリプトの動作を理解していない限り、有料スクリプトの購入・使用を推奨しません。コミュニティスクリプトには無料のオープンソースの代替が多数あります。
作者の指示
免責事項
この情報および投稿は、TradingViewが提供または推奨する金融、投資、トレード、その他のアドバイスや推奨を意図するものではなく、それらを構成するものでもありません。詳細は利用規約をご覧ください。